When I made the change from my postdoc role in neuroscience to data science at Stitch Fix, I was hoping to get to do more of the thing I loved most about being a scientist: collaborative data-driven discovery. That’s exactly what I got, and I have the data to prove it.
For the past three years I’ve been tracking how I spend my time with an app called Toggl. I click a button when I start working on something, enter a title, and it keeps a timer running until I switch to the next thing. It helps me understand where my time goes and satisfies some neurotic tendencies.
Categorizing my time
To get a deeper picture of how my day to day has changed, I categorized my tasks into distinctive categories that had as much overlap between the two jobs as possible. For example, “meetings” include academic journal clubs, weekly one-on-ones with my advisor, and also meetings with my business partners in marketing and finance at Stitch Fix.
I ended up with eighteen categories, but 90% of my time fell into the following:
- analysis and learning
- writing papers
- writing grants
- meetings
- ad-hoc requests
- miscellaneous, e.g. email, community service (like reviewing papers, reviewing team blog posts), building experimental equipment, reading journals or industry news
The proportion of any given week dedicated to each category is shown below:
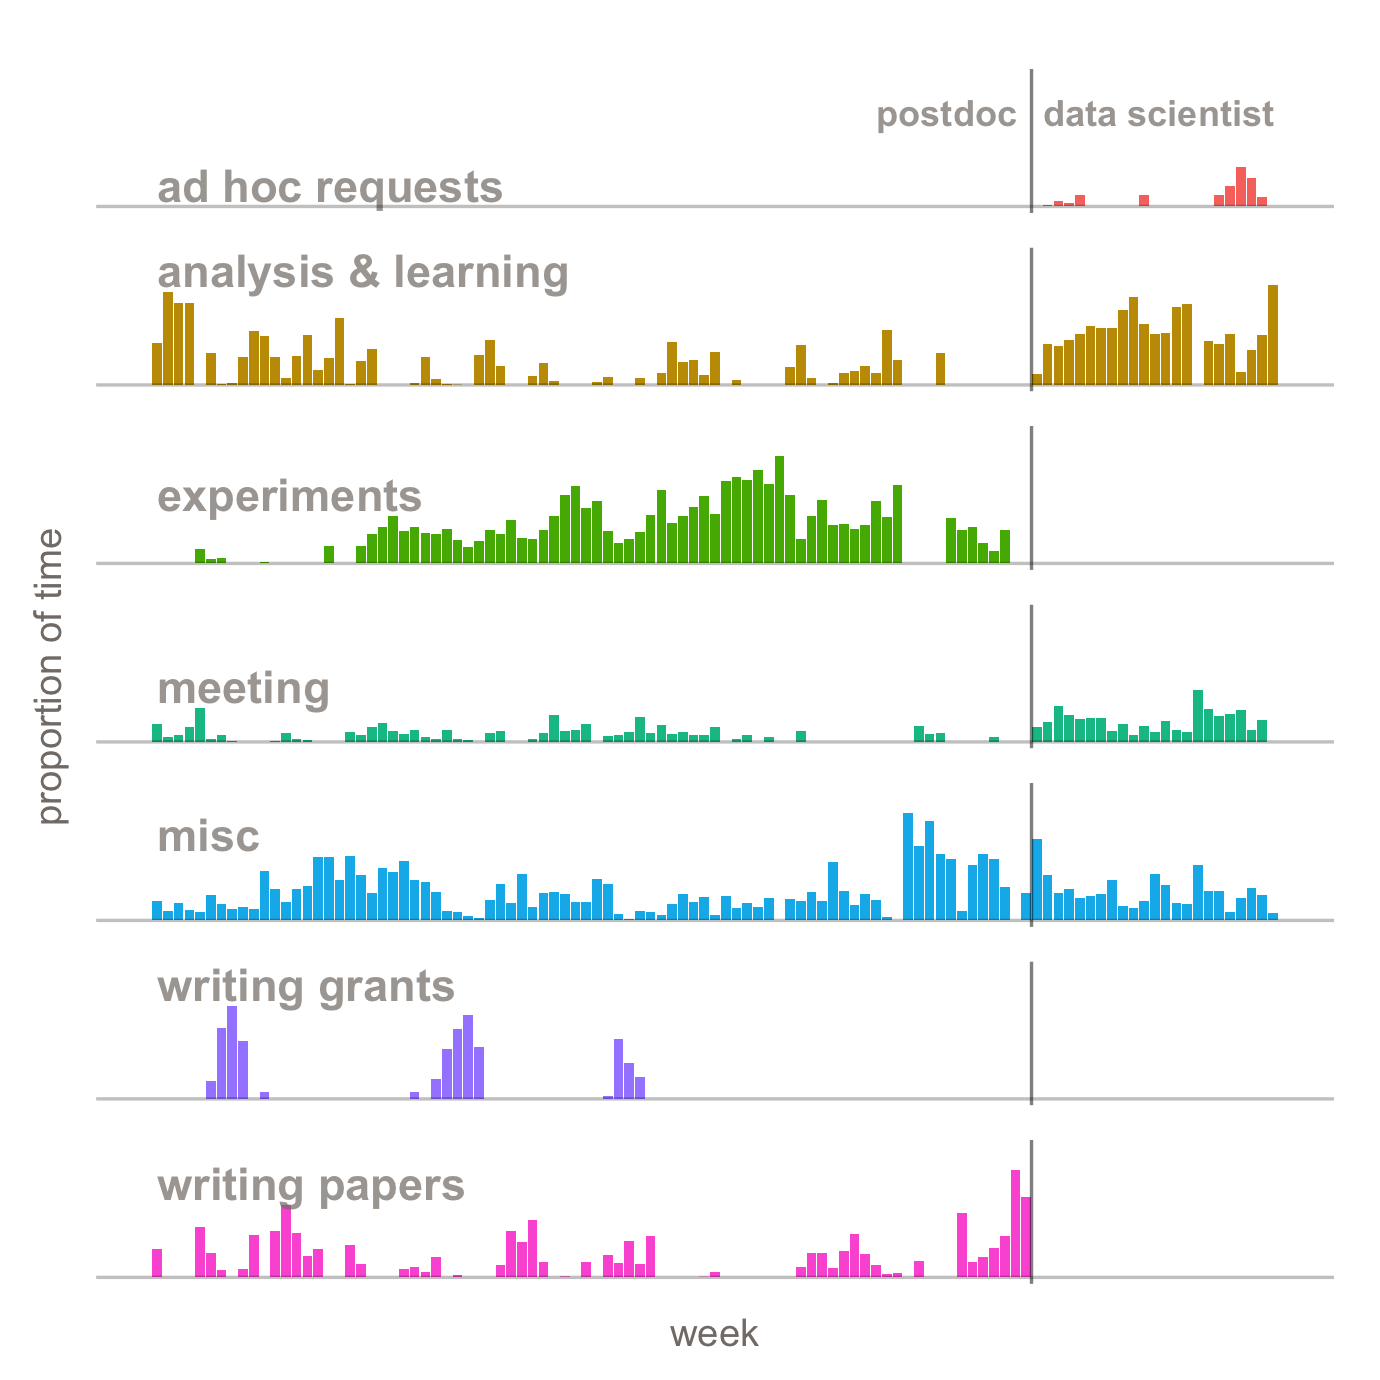
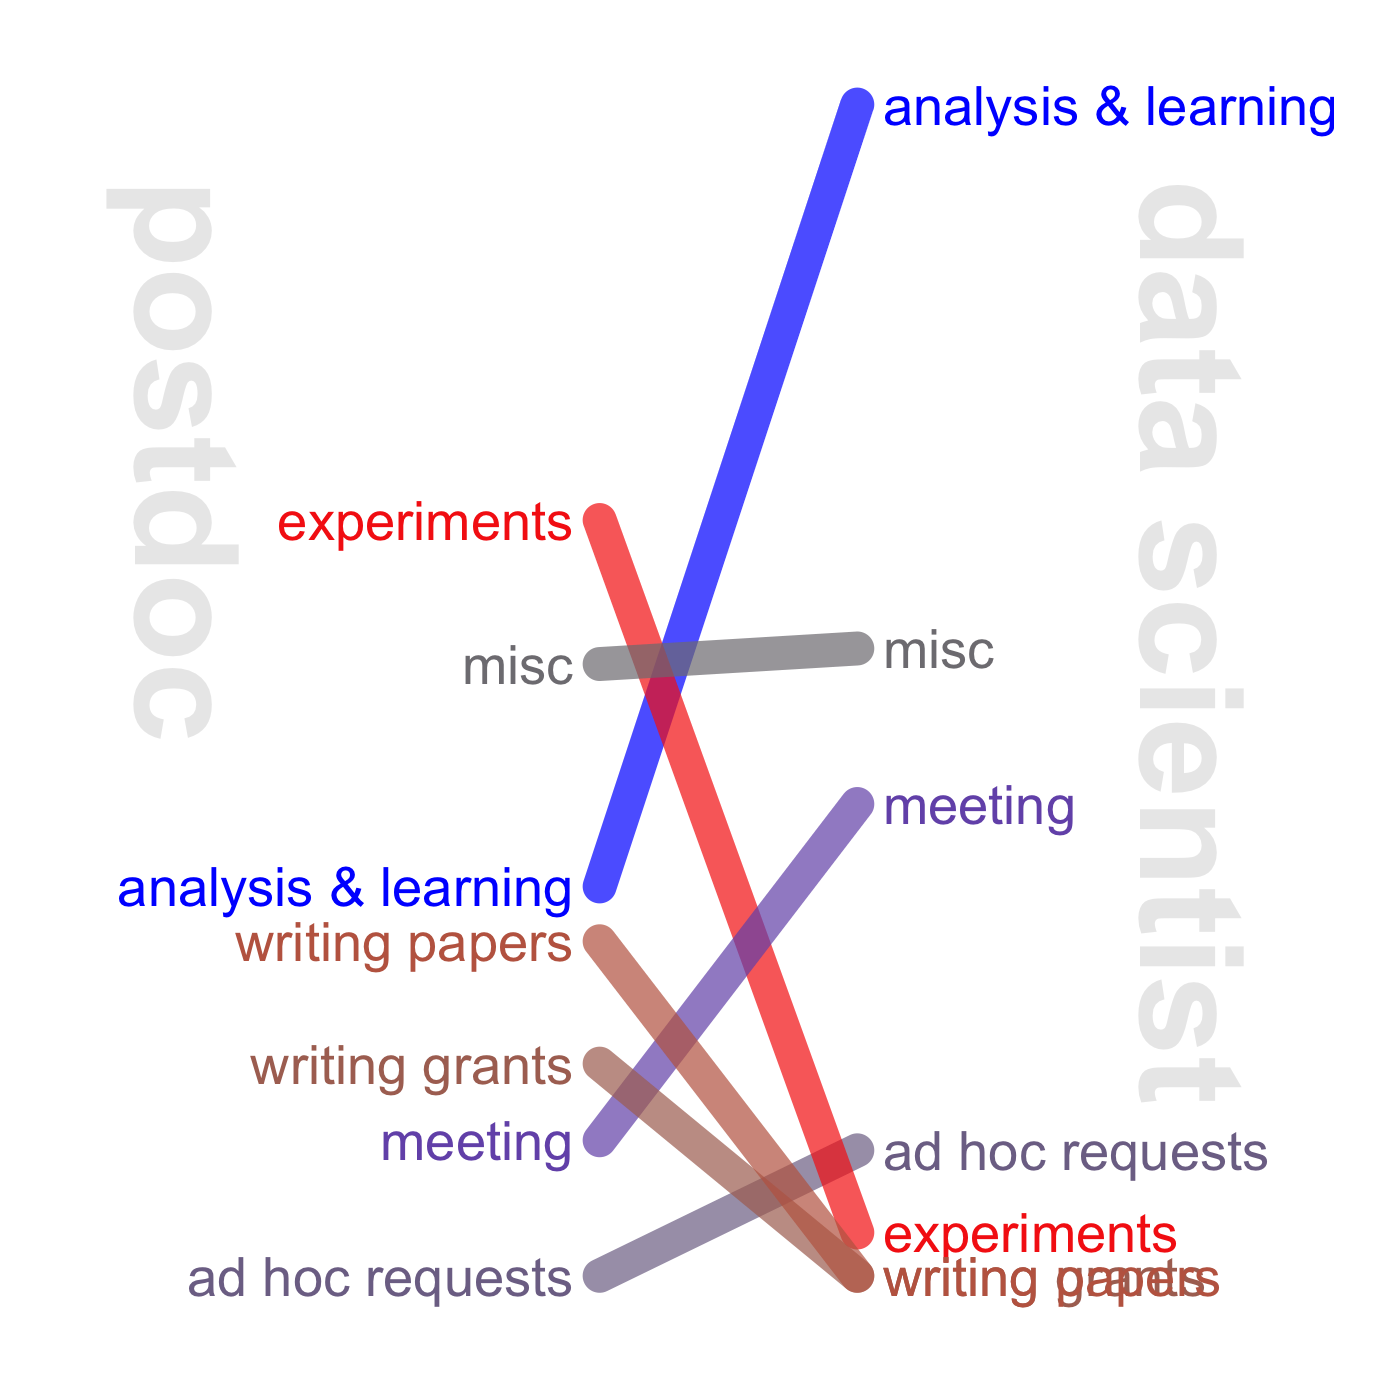
Where does my time go?
Four themes emerged when I started analyzing the data:
- I spend more time playing with data
- My work is more collaborative
- I spend less time writing, and more on ad-hoc analyses for other teams
- I do a lot less data munging
More time with data
I was an experimental neuroscientist, so it’s not surprising that I spent the bulk of my postdoc on experiments—collecting and processing data. Had I finished out my postdoc fellowship, the time spent on experiments would have been replaced by analysis, writing, and job applications, so the plot above is not representative of a complete academic project. Nonetheless, it’s striking to see how much of a two-year span I spent in a lab coat. Only about 20% of my first two years were spent on analysis. At Stitch Fix, data had been streaming in long before I started, so I got to dive right into analysis when I joined. I love that I’ve spent more than half of my time on analysis in the five months since I started. Further, when my data science work broadens to include experimentation (e.g. A/B testing), the nature of it will be quite different: I will spend most of my time on the fun parts of designing and deploying an experiment and much less time on daily repetitive work needed to collect the data. Overall, data science has provided me with the opportunity to spend more of my time on creative work.
More collaboration
Becoming part of a team working toward common goals has meant that I now spend about four times as much of my time in meetings with my team or my business partners than I did as a postdoc. Before the switch, when most of my knowledge about business meetings came from TV, I would have been unhappy about this change, but it has turned into one of the most surprising positive changes in my transition. The business’ short-term priorities can change quickly, so frequent check-ins keep everyone up to date on goals and expectations. Some meetings provide an opportunity for all corners of the business to get together and efficiently identify new goals and solutions. It makes for really fun and agile work. It can sometimes be an effort to balance these often short-term tasks with bigger, broader goals but I appreciate being able to make those tradeoffs consciously.
Less writing, slightly more ad-hoc requests
I no longer write papers or grants, although papers are not off the table and there are lots of other opportunities for writing. I really enjoyed writing grants and papers (I know, I know) and I considered including these in the fun “analysis and learning” category, but I found writing’s all-consuming nature really neat to visualize in the graphic here. In their place, I’ve acquired ad-hoc requests—things like querying our databases for data that other teams can’t access directly. Some people consider these a drag, but I have enjoyed the opportunity to learn about parts of the business that I may not typically think about. Far from all-consuming, they haven’t yet taken up much of my time. Partly this is because I have been relatively new and partly because Stitch Fix empowers members of other teams to access the data they need on their own. The number of requests has been ramping for me recently, so time will tell where I stand a few months from now.
What about data munging?
Having read many posts about the life of a data scientist before I became one, I expected to spend a lot of time on data munging—getting data into a usable format from things like log files, third party tools, or unstructured formats like freeform text. It turns out, I haven’t had reason to track munging because I do so little of it. I landed in a mature data team, supported by a stellar data platform team so most data I need is easily accessible. I occasionally spend time verifying accuracy of data or fixing database errors but this hasn’t felt like a big chunk so far. I’d also like to point out that as a neuroscientist I spent as much as three hours after each day’s experiment extracting usable action potential timestamps from analog neuronal voltage signals. Munging is by no means unique to the tech industry.
More immediate impact
Although my Toggl data does not speak to the difference in project timescales between academia and industry, the striking change of pace is worth mentioning. In academia I worked on projects that typically required 2+ years of data collection before I could get to the bulk of the analysis and discovery. In my current role, my team’s simulations and forecasts guide core business operations on a weekly, quarterly, and annual basis. My progress and impact is more immediately tangible, with a clear path between analysis and action. As a result, the days and weeks are more fulfilling and every successful quarter for the business feels like an awesome team win.
So, should you make the switch?
This is, of course, just one data scientist’s story. The amount of time spent on analysis, munging, and ad-hoc requests will vary widely across companies and data science teams. I have found my preferred split, but yours may be entirely different.
The good news is that the world of industry and technology offer much more career mobility and more career paths than we’re used to in academia. For example, you can start out being a jack-of-all trades data scientist and then delve deeply into machine learning in your next role. You might end up managing a team, and then go back to building models. Whatever your optimal path is, chances are that you can find it as a data scientist.
About Alex
Alex got her Ph.D. in Neurobiology at Harvard studying the neural basis of decision-making and was a postdoctoral fellow at The University of Pennsylvania for two years. She made the transition to data science at Stitch Fix via the Insight Data Science Fellows Program. When not tracking her work hours, she can be found in search of great snow for skiing or the nearest marsh for birding (she tracks that too).