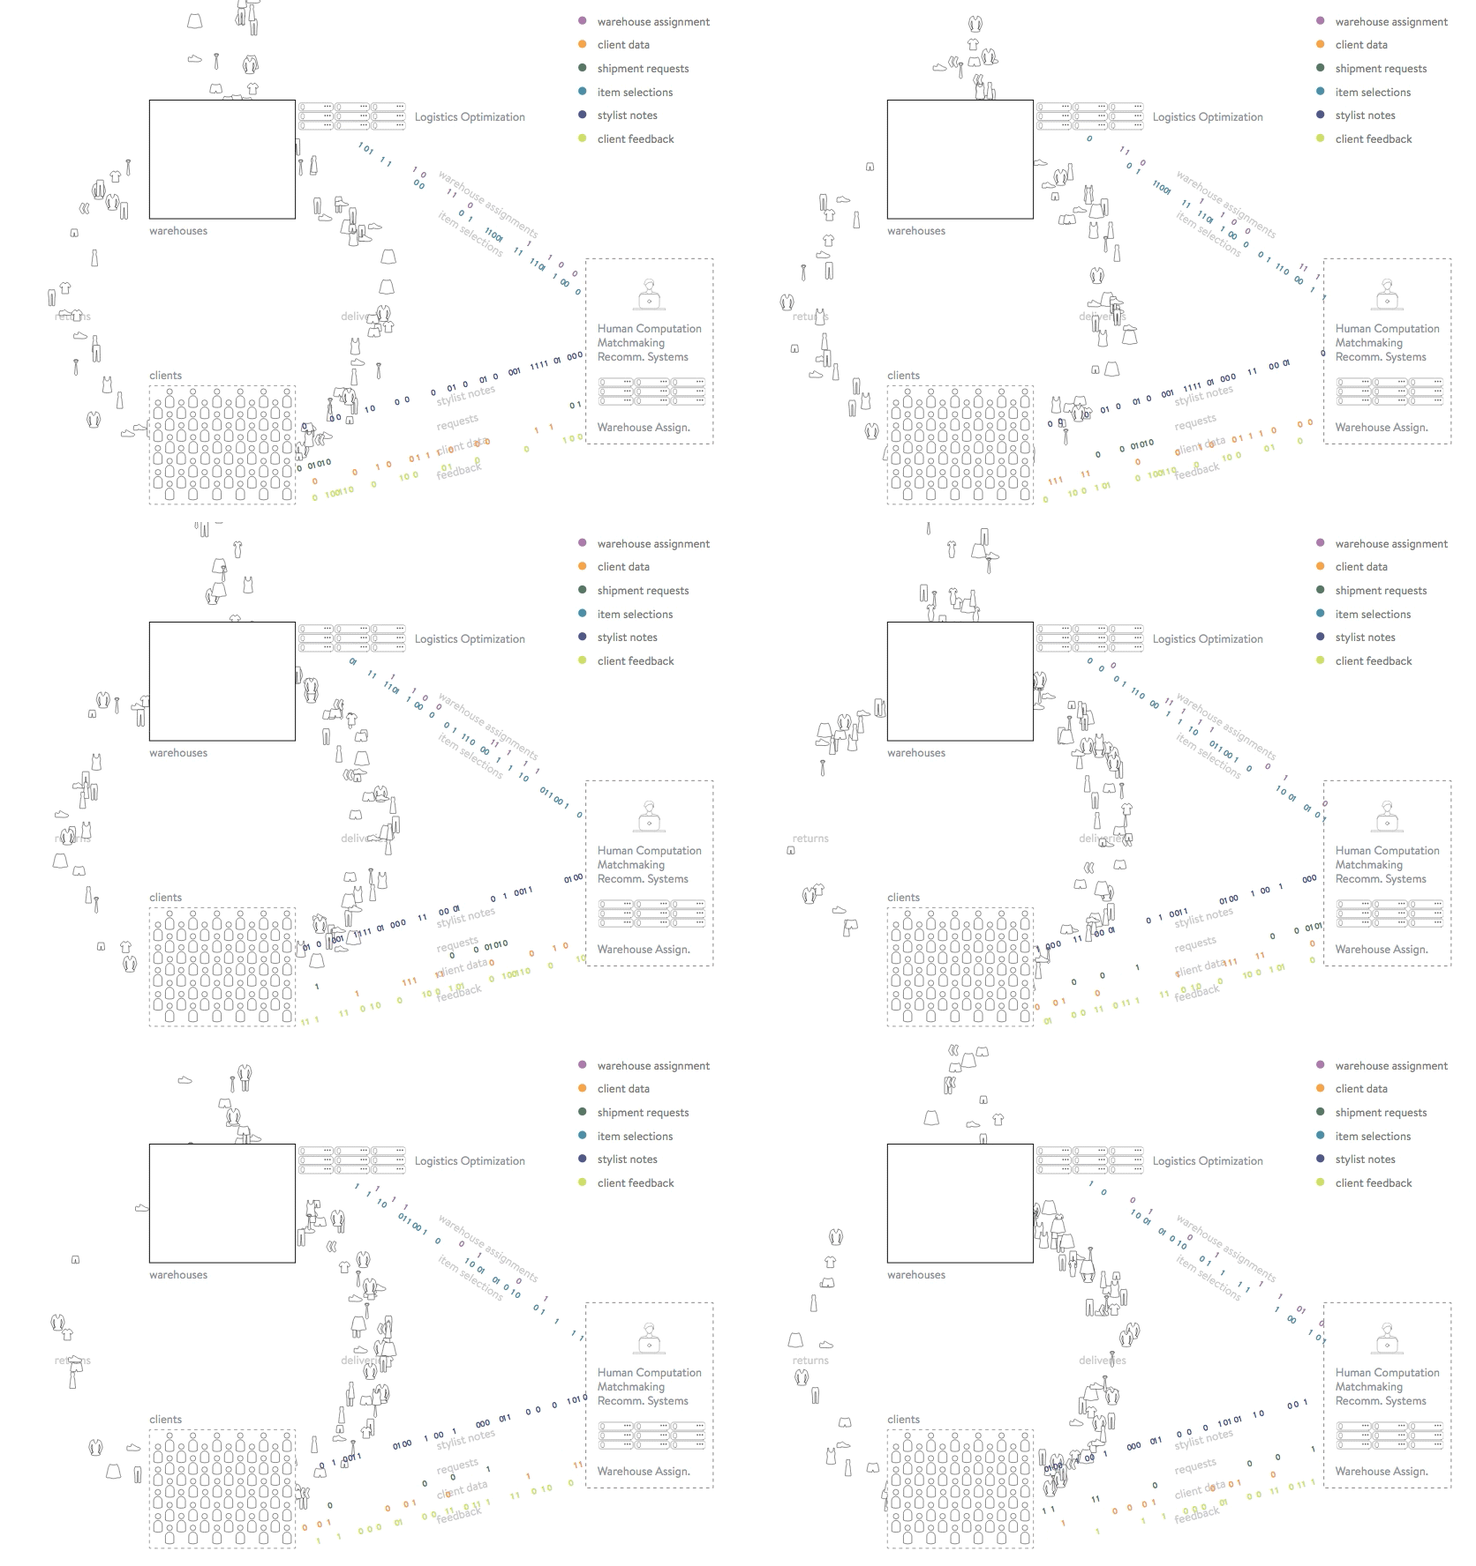
It’s amazing what can be enabled via data science. It’s one of the most effective ways for a company to differentiate themselves, and also solve problems effectively and efficiently. An apparel retailer may not be the most intuitive place for 70+ data scientists to practice their craft. But Stitch Fix is not a typical retailer. Our business model has nuances which afford rich data and has novelty that enables new approaches. The result is empiricism woven through the fabric of an organization.
So, what do 70+ people do? In this interactive tour we share ten “stories” of how data science is is integral to our operations and product.
The goal is to show the diversity of application. Far from being a team of 70+ working on one single problem, we’re much closer to being a team of 70+ working on 70+ problems (to be sure, it was a challenge to restrict to only ten stories!). We’ve heavily animated each story to give the viewer a visceral sense of the relationships. The navigation is self-paced, allowing the viewer to read the sidebar text which gives more context to animation.
We’ve included just enough math to succinctly convey the framing of each solution so the viewer can extrapolate to other domains/companies. In some cases we link to a blog post where the viewer can get more details into an individual story. Strewn throughout the tour is the concept our team is perhaps most well-known for: personalization. An individual shipment (a “fix”) of a single client traverses through the Stitch Fix processes, benefiting from each as it passes. In turn, each process benefits from the experience as well, learning and improving for future shipments and clients yet to come. It’s a positive feedback loop that strengthens our systems and our relationship with our clients over time.
I can’t think of a stronger, more effective medium to tell this story than an interactive and animated tour. Many thanks to our data scientists and creative talent who pushed the limits of javascript to bring it alive. We hope you enjoy scrolling through and seeing our data stories in action. If it inspires you to think about where you can use data science at your own company then we’ve achieved our goals.
Ps. We’ve made the GitHub repo backing the site open to the public so that you can poke around and see how we built it.

