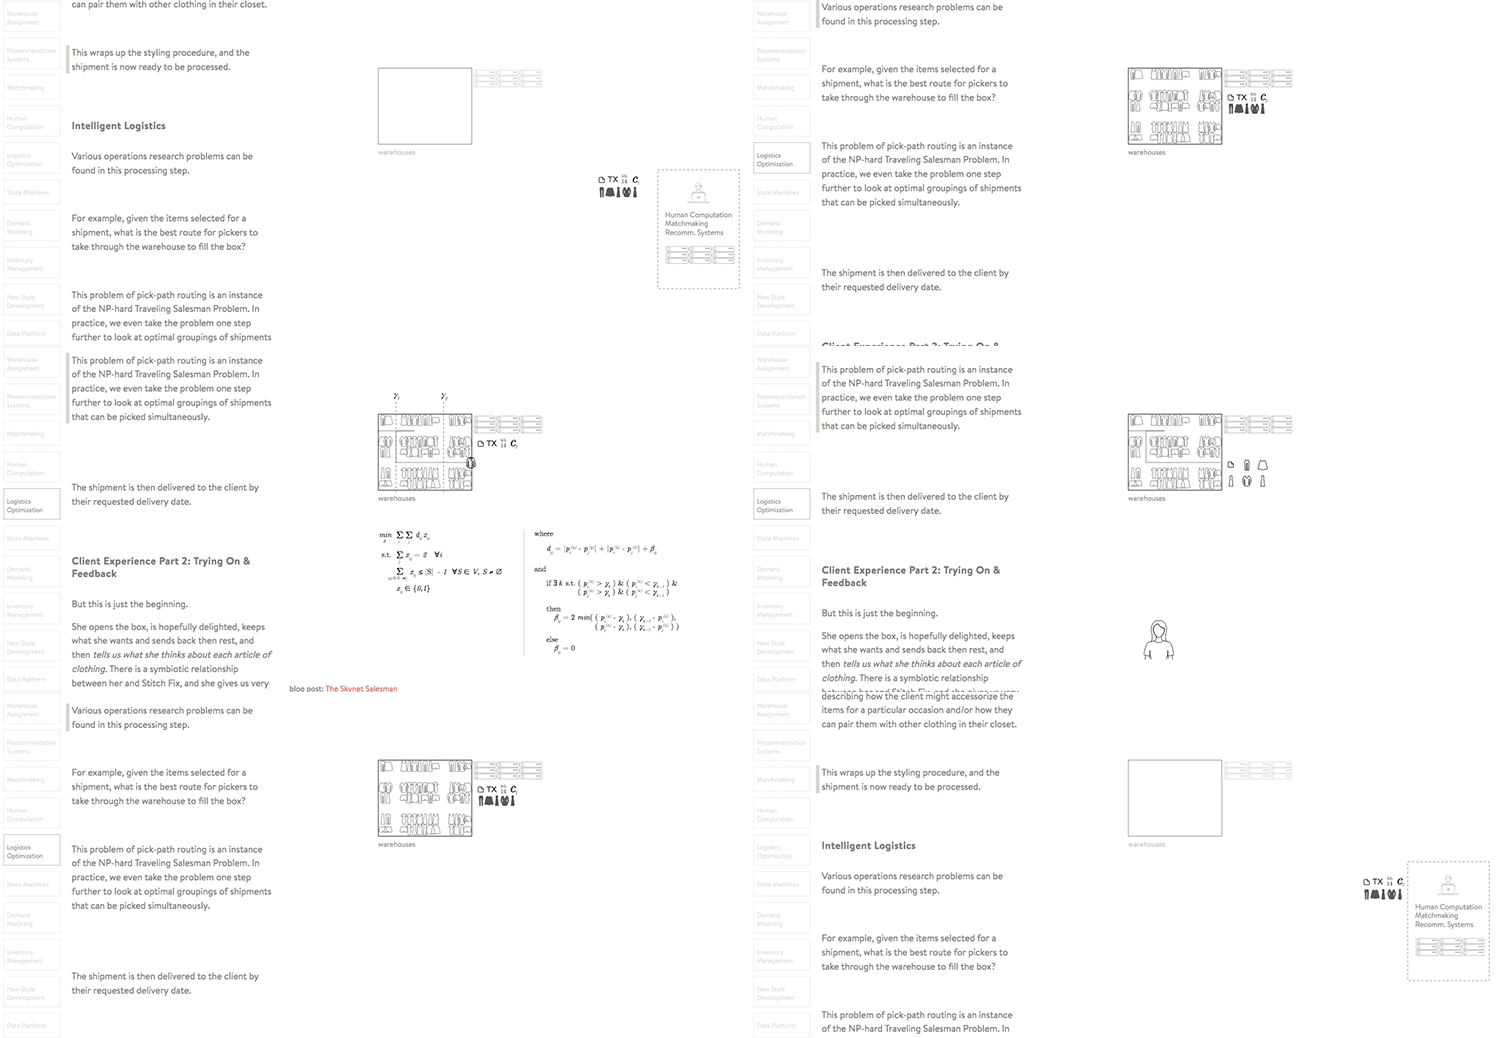
Earlier this month, we released an interactive animation describing how data science is woven into the fabric of Stitch Fix: our Algorithms Tour. It was a lot of fun to make and even more fun to see people’s responses to it. For those interested in how we did it, we thought we’d give a quick tour of what lies under that Tour.

In a short series of blog posts, we’ll describe how we made it and provide some starter-kit code with each one. In this post we’ll first describe our high-level motivations and our development process, and then explain how this translated into our overall code structure. (If you’re itching for the code, feel free to jump right in.)
Inspirations
There is a surprising breadth and depth of data science application at Stitch Fix. Some of this is demonstrated in our blog, but we hoped to find a more cohesive public expression of it. We drew inspiration from the scrollytelling coherence of Stephanie Yee and Tony Chu’s Visual Introduction to Machine Learning, from the illustrative clarity of Victor Powell and Lewis Lehe’s Explained Visually project, and from the content and mathematical descriptions in Ilya Katsov’s post on Data Mining Problems in Retail. Our goal was to create something fun, informative and hopefully attractive.
Process
Two aspects of our development process are pertinent here. One is that it was highly iterative and creative: sketch, build, repeat, with a tight loop of hours to days. Even the ‘build’ step was essentially a creative loop of minutes to hours; the process had more in common with jointly developing text in a google doc or group-painting than it did with some sort of spec design and handover. New ideas would flow from seeing the previous ideas in situ, and dead-ends quickly avoided, and the faster we could get ideas into animated form the better this loop worked.
The second noteworthy aspect of our process was that the text, mathematical descriptions, images and animations all grew up together as a single entity, rather than building one first and then appending the others to it. Though we didn’t know exactly where it was all going until we saw it start to converge, we knew all along that it was meant to be a cohesive animated-mathy-illustrated-story, and we treated it as such throughout.
Scrollytelling Code Structure
We jumped into code quickly, and wrote some pretty rough and tumble stuff to see things in action. In the long run, our code would probably have been cleaner and more elegant if we had used javascript libraries specifically tailored to animation (GreenSock springs to mind), but as data scientists on a creative mission, we went with what we know, so Mike Bostock’s D3.js library played a major role.
Jim Vallandingham’s D3-based scrollytelling code worked wonderfully in our development context, quickly getting us to text-plus-animation. To iterate quickly with illustrations and animations, we used a lot of Adobe Illustrator (though any other such tool would also work) to make vector illustrations, or to vector-trace our hand-drawn sketches, and then put the resulting svg group elements directly into the html as starting points for animations with D3.js. Making the illustrations with an eye to their use in animations via javascript takes only a tiny bit of getting used to before becoming second nature. Writing math in Illustrator is not ideal, but this was just a minor hassle and well worth it to keep things nicely integrated.
We’ve open-sourced the code for the tour in its final form, and the readme provides a bit of an entry point and guide. But it’s not the cleanest code you’ll ever see, and maybe not ideal as a starting point for other such animated-mathy-illustrated-stories, so we’ve created a relatively bare-bones version of the high-level structure we used for the tour: see the code and demo. We’ll be excited to see it used by others, so please do.
Stay Tuned
In forthcoming posts we’ll walk through some of the simulations used in the Tour and go over some other animation details. More code ahead!
