
As data scientists tasked with segmenting clients and products, we find ourselves in the same boat with species taxonomists, straddling the line between lumping individuals into broad groups and splitting into small segments. In the same way that genomics has dramatically changed biologists’ ability to identify narrow species and group them into complex hierarchies, a bounty of rich individual-level data has enabled data scientists to create increasingly fine taxonomies for clients, behaviors, and products. Yet, in both worlds, it can sometimes be more productive to focus on fewer, larger groups to streamline decision-making. The approach for drawing the boundaries therefore needs to take into account signals from the data while maintaining sharp focus on the project needs. In this post we’ll explore strategies for lumping and splitting and take a look at the tradeoffs.
To lump or to split?
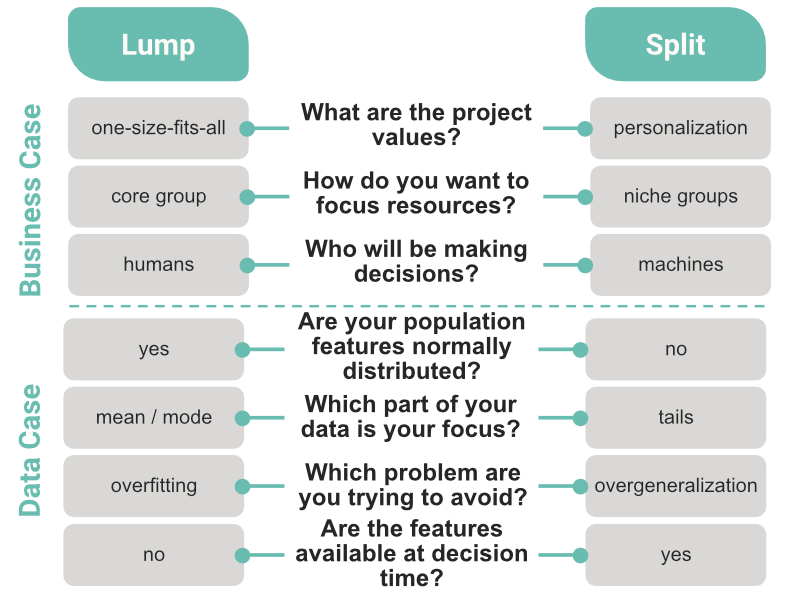
The right balance between lumping and splitting gets you a taxonomy that guides you toward emerging opportunities without drowning you in irrelevant details. On one hand, fewer segments enable clarity and speed of execution, especially when the decisions are made by humans. On the other hand, the finest splits can help us understand the true diversity, reveal blind spots, and highlight promising opportunities. The handy chart below highlights some questions you might ask yourself and your team when deciding whether lumping or splitting is right for your problem.
Ecologists face these tradeoffs when defining species to target for conservation efforts. They strive to devote resources to distinct species that live in localized habitats, which we might call niche groups — a great reason to choose splitting. Yet one study found that although there might be as many as 18,000 bird species on Earth based on breeding plumage, only about half of them can be consistently distinguished in the field. Since it’s humans who make conservation decisions on the ground, some lumping is necessary to develop a taxonomy that’s useful to conservationists in practice.
At Stitch Fix, individual personalization is in our DNA: every client is unique and every piece of clothing we send is chosen to be just right. When we buy merchandise, we could choose to lump clients together; algorithms trained on lumped data would steer us toward that little black dress or those comfy leggings that delight a core, modal group of clients. Yet when we split clients into narrower segments and focus on the tails of the distribution, the algorithms have the chance to also tease out that sleek pinstripe blazer or that pair of distressed teal jeans that aren’t right for everyone, but just right for someone. As long as we don’t split our clients so finely that we’re in danger of overfitting, and as long as humans can still understand the algorithm’s recommendations, splitting is the way to go.
In other cases lumping can provide action-oriented clarity for human decision-makers. For example, we might lump clients into larger groups when reporting on business growth for a crisp understanding of holistic business health, even if our models forecast that growth at the level of finer client splits.
Constructing a segmentation
When creating segments, species taxonomists consider features like individual genetics, plumage, methods of communication, food sources, and habitat to come up with boundaries. At Stitch Fix, we might consider client features like style preferences, lifestyle, and body shape. As with any model, remember that the features available in the input dataset will constrain the universe of segmentations that you can get — you can’t model what you don’t observe.
 In exploratory analysis we look for boundaries where our feature distributions aren’t well described by a normal distribution — they are multimodal, have fat tails — or have uncomfortably high variance. We examine individual examples along different points on the distribution to get a feeling for whether they would make sense as a few groups or as many groups.
Once you’re ready to draw the boundaries, you can reach for any of a menagerie of computational clustering techniques. If your use case has imposed constraints on how many segments you must have, you might want to choose a method like k-means that allows a priori specification of the number of clusters, or methods like matrix factorization (e.g., PCA) or hierarchical clustering that can be analyzed to just the right depth of splitting. Or, if you want the balance between lumping and splitting to be primarily data-driven, you might prefer methods like DBSCAN or the Chinese Restaurant Process that algorithmically discover the best-fitting number of clusters. Note that these methods vary in the expected sizes and shapes of the clusters. For example, k-means clustering tends toward spherical, similarly-sized clusters, while density-based methods don’t impose such constraints but rely on individual proximity in the feature space. Many of these algorithms have implementations in scikit-learn and R and you can find lots of great tutorials, including here, here, and here.
Other considerations when choosing a clustering method include scalability and ability to assign new observations into predefined clusters as your data grows. Keep in mind that these depend on the expected growth of your data, the speed of evaluation, and whether you intend to assign individuals “live” or in batch.
In contrast to supervised learning, where industry-standard metrics like AUC exist for model evaluation, there is no single silver-bullet method for assessing the validity of unsupervised clustering models. If your use case requires cohesive, well-separated clusters, the silhouette coefficient can measure this; if clusters should be stable, bootstrapped evaluation of the Jaccard coefficient can measure this; if fit of individuals to their segments is important, log likelihood can measure this. At the end of the day, the true validation of your segmentation is whether it is appropriate to your project and provides business value.
The final step in building a segmentation is choosing names for the segments. Names should be short, memorable, and evocative of the most salient features of the group. Be wary of choosing a name that applies only to part of the segment, because it will lead people to assume that the segment is more homogeneous than it actually is.
If no segmentation can be found that fits the data sufficiently well, it may be because the original dataset is missing important features that actually drive the variance. Or it could be because…
…maybe your data is actually continuous?
Not all real-world problems and not all data sets easily lend themselves to segmentation. Take the greenish warbler, a songbird that lives in a ring-shaped territory that wraps around the Himalayas. All along its range, individuals can understand the songs of their neighbors — but birds at one extreme end of the range can’t understand songs from the other extreme. Is it one species or two? Or infinitely many? It’s clear that there are important differences to capture, but there’s no obvious place to split the population. Similar problems arise with splitting people into generations (who is a Millennial, really?), into sizes (is there a clear line between XXL and Plus?), etc.
 In gradually and smoothly varying distributions, there is often no right way to draw dividing lines between segments, even if the ends of the distribution are qualitatively distinct. In these situations, sometimes the best answer is to honor the continuous nature of the data. Linear models or generalized additive models (GAMs) are useful for modeling variation along continuous features. Or, if the business case requires discretization, you can think back to the trapezoidal rule of integration from calculus and approximate a continuous function by a series of narrow slices.
Best of both worlds
As data scientists, a big part of our jobs is figuring out how to surface the right amount of complexity to our business partners — not too much, not too little. We also care about surfacing salient information at the right time — not too early, not too late. These considerations make it difficult to choose between lumping and splitting in situations where the real-world problem is dynamic and quickly evolving, implying that the segments that are useful today may no longer be useful tomorrow.
 When it’s important to have the benefits of splitting finely while focusing on a small number of relevant segments, this is a great opportunity to let humans and machines do what they each do best. Algorithms can be designed to segment the data to as fine a granularity as the data supports. Then, algorithms can dynamically detect the key outlier segments that deserve extra attention, and aggregate the other segments back into larger groups. What gets surfaced to humans are the important findings about the forest, as well as highlights of the handful of trees that matter right now. Such flexible segmentation schemes enable people and algorithms to adapt together to changing data and changing business priorities.
Our decisions about birds and business are never perfect. Limited conservation resources put constraints on how many populations biologists can reasonably support. Likewise, limited capital and people power put constraints on how many client populations a business can prioritize simultaneously. A balance between lumping and splitting allows us to make the best data-driven decisions we can with the resources we have.