Back in September – before the start of the 2015-2016 NBA season – we wrote a post about the Golden State Warriors that was titled “Strength in Numbers: Why Golden State Deserved to Win in All.” The post explored whether Golden State got lucky last season. Were they carried by their momentum and aided by injuries to the opposing teams, or did they simply have the best basketball DNA? Our conclusion was that Golden State did indeed have the best DNA, although the final series against Cleveland would have been a very close series if Kevin Love and Kyrie Irving had been healthy.
This year, Golden State is amassing a historical season. It’s entirely conceivable that Golden State will beat the record of 72 regular-season wins currently held by the 1995-1996 Chicago Bulls. But does this mean that Golden State will cruise to the title this year?
To answer that question, you have to analyze how Golden State matches up against the San Antonio Spurs and the Cleveland Cavaliers. There are many other strong teams in the NBA, sure, but San Antonio and Cleveland are generally considered to be the main obstacles.
Now, we all know what happened when Golden State played these teams earlier this season: a close win against Cleveland at home, a 30-point win over San Antonio at home (sans Tim Duncan), and a 34-point win over Cleveland on the road. These results could easily lead one to the following conclusion: Cleveland and San Antonio are not real threats and, barring any significant injuries to a key player, Golden State should feel good about their chances of a repeat.
Not being satisfied with the analytical robustness of mere reasoning, we consulted the model described in the post mentioned above to determine how Golden State’s DNA matches up against Cleveland’s and San Antonio’s. The short answer is that, according to our model, Golden State should be worried about both teams – although San Antonio appears to be the bigger threat of the two.
Methodology – Leveraging Archetypes to Predict Wins
As mentioned in the previous post, the model used to evaluate these scenarios is based on team “DNA” – i.e., player archetypes – and purposefully ignores winning percentages and momentum. Momentum comes and goes, but solid DNA does not.
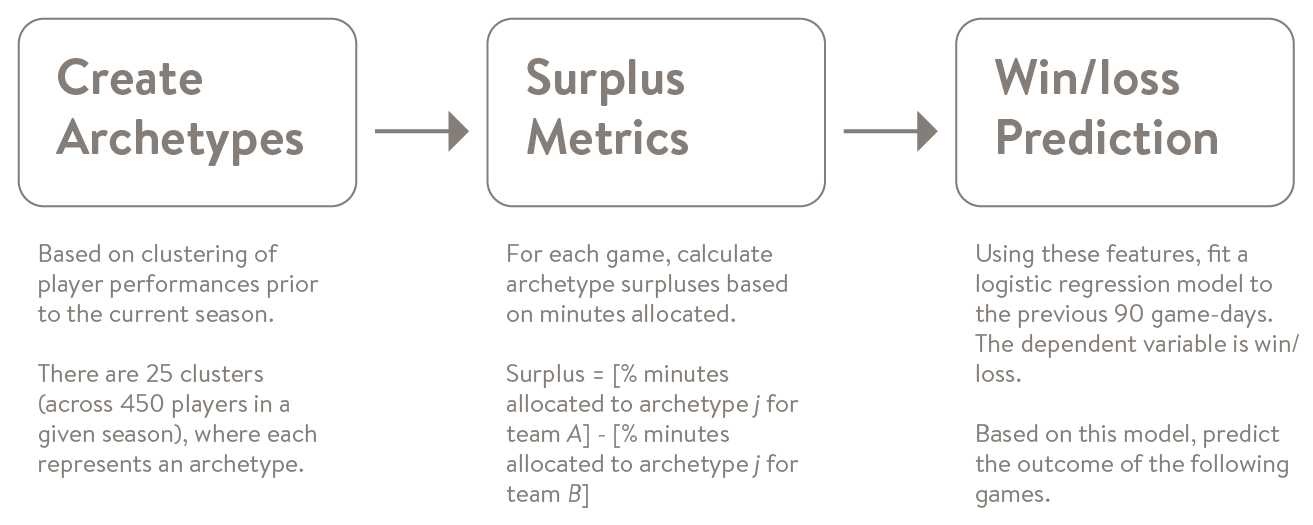
In short, the model will predict a win for a given team if, compared to the opposing team, there’s a sufficient “surplus” of minutes allocated to powerful archetypes. Some technical notes about this model:
- The model has 26 potential features: a home game indicator, plus 25 archetype-surplus variables.
- There are typically around 400-500 games played over 90 days. Thus, when fitting the logistic regression model, we use lasso regularization and v-fold cross validation to promote sparsity and avoid overfitting.
- The model assumes that we know the allocation of minutes across archetypes. This reflects the coaching decisions and controls for injuries and suspensions.
- The one-day-ahead accuracy (percent of games correctly predicted) for the current season is 66%, and the one-day-ahead AUC statistic is 0.70.
For more details on this see the post from September.
San Antonio is the Biggest Threat
Let’s take a look at what the model would have predicted for the three games mentioned earlier:
- Home game against Cleveland on 12/25. Probability of Golden State winning = 58% (Golden State won by 6).
- Away game against Cleveland on 1/18. Probability of Golden State winning = 56% (Golden State won by 34).
- Home game against San Antonio on 1/25. Probability of Golden State winning = 45% (Golden State Won by 30).
Before we interpret these results, let’s first remind ourselves that this model ignores win percentages and momentum. As stated earlier, this is done on purpose in order to purely compare the DNA of each team. For reference, the model has only made five incorrect predictions for the Warriors for this season. The game against San Antonio was one of them, and the other four were the losses against mediocre teams (Dallas, Detroit, Milwaukee, and Denver).
Based on these probabilities, the model believes that Golden State can beat Cleveland both at home and on the road – although the margin of error is small. San Antonio, however, is a different story; the model believes that San Antonio should have narrowly won the game on the Warriors’ home court, despite Gregg Popovich sitting Tim Duncan.
So what does this mean? It means that Warriors fans, such as the Data Science team here at Stitch Fix, should be worried about the Spurs. Despite what the win might suggest, the Spurs match up well against Golden State and tend to rise to the occasion in the playoffs.
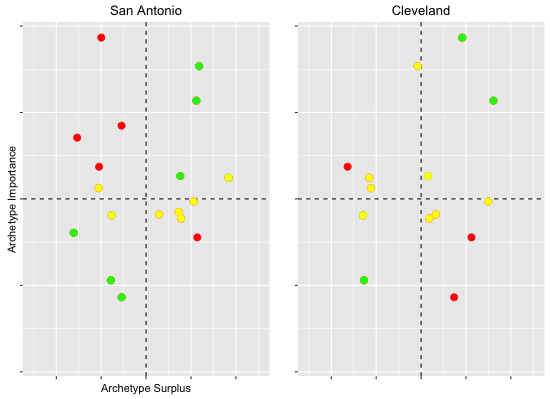
Visualizing Match-ups with Surplus/Importance Charts
We can visualize these results by scatter-plotting the importance of the archetypes against the surplus/deficit of minutes allocated to each archetype. Here importance reflects the coefficients of the logistic regression model mentioned above – i.e., the impact on win/loss for every unit of surplus for the given archetype.
Some notes about these plots:
- You want as many dots as possible in the diagonal quadrants (NE and SW). These dots are highlighted in green.
- You want as few dots as possible in the off-diagonal quadrants (NW and SE). These dots are highlighted in red.
- We used yellow for dots that are on the cusp.
- Each dot represents an archetype (cluster), which can represent multiple players for a given game.
- Note that each team may not have representation for all archetypes. For example, a dot in the SW quadrant could mean that the opposing team has one or more players that belong to a “bad” archetype, while Golden State does not.
Note that we see a mix of green and red dots for the Cleveland and San Antonio. These are going to be hard-fought series for Golden State if we meet them in the playoffs.
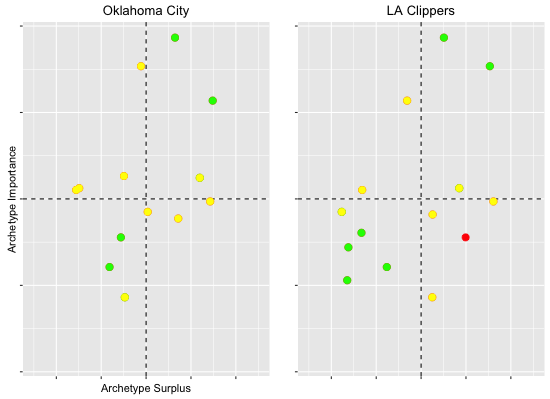
Now, what about Oklahoma City and the Los Angeles Clippers? These teams are right behind the Spurs in terms of winning percentages and Oklahoma City is currently number three in the overall ESPN Power Rankings. Should Golden State be worried about them? According to the model, Oklahoma City and the Los Angeles Clippers pose much smaller threats than San Antonio and Cleveland. For reference, the model predicts a 60-70% chance that Golden State will win a given game against either team. The charts below illustrate this; there are almost no red dots.
Last Words
The main take-away is that Golden State has a deep and diverse roster. For any given game, they’re able to create a surplus of minutes allocated to powerful archetypes and hence put themselves in a position to win.
The problem here is that San Antonio also has a deep and diverse roster. If they are healthy come playoff-time, they will pose the most serious threat to Golden State’s title repeat (according to the model).
It gets even more interesting when we start to look at the players behind the archetypes. But that’s beyond the scope of this post. Although we should reveal that one of the persistent green dots in the upper-right quadrant is fueled by no other than Shaun Livingston.
