Data is embraced as a first-class citizen at Stitch Fix. In order to power our complex machine learning algorithms used for styling, inventory management, fix scheduling and many other smart services, it is critical to have a scalable data pipeline implementation. This pipeline must consume and move data efficiently as well as provide low latency, high availability, and visibility.
Traditionally, there are two types of data acquisition methods. One is using a scheduler to run batch jobs to collect data. The scheduler decides how frequently a job is executed and each job collects up to whatever data is available at execution time. This will ultimately create a delay of data availability due to the execution interval. The other is consuming data in real time. In this case, a service is used to poll data from the source when it is available and/or listens to a source which publishes or sends data. This post will focus on solving the latter case.
Know the Data Source
Understanding the source of the data is the first thing to start with. At Stitch Fix, almost all business related data is produced by our Engineering department. Their data is used heavily in the Algorithms department to discover business insights and to better serve our customers. The Engineering department uses RabbitMQ as their communication channel of choice, and so Algorithms has a dedicated RabbitMQ queue to consume real time events from. This is one of the most important data sources for us. We also have various clients (think mobile & web) generating events data. Some of this data is going through a third party service such as Segment. Other than the above business related data, there is a large amount of log data created by our infrastructure including application logs, web traffic logs, etc. We are a big fan of micro-services here at Stitch Fix and they compose more than 80% of our infrastructure. Thus those infrastructure logs help us to understand the state of our infrastructure and many notification/monitoring solutions can be built on top of them.
To summarize, the following data sources need to be supported.
- RabbitMQ
- Web/Mobile clients
- Nginx traffic logs
- Web service application logs
- Third party events such as Segment
Think About the Architecture
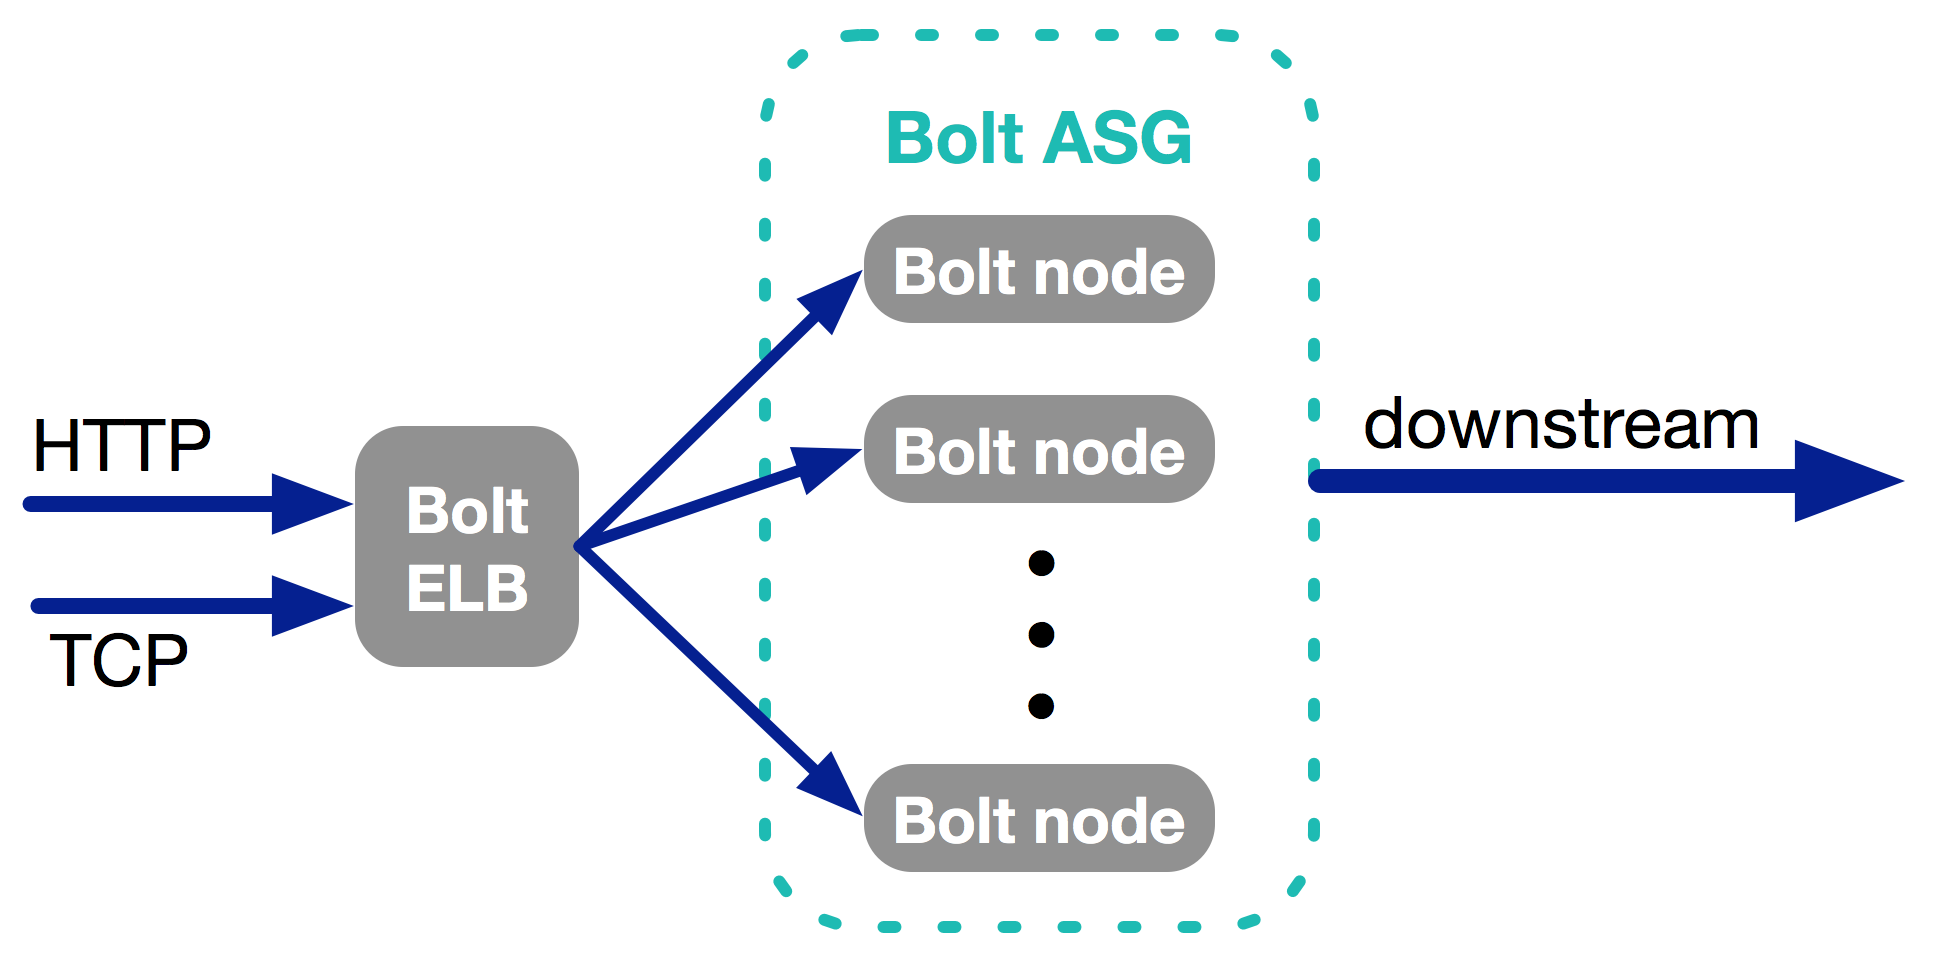
After understanding the data sources, the second step is to design architecture which supports both polling and listening. The solution should be a stateless service which has both an HTTP listener and a TCP listener. The stateless requirement guarantees that the service can be put into an Auto Scaling Group which solves any scalability requirement. The HTTP endpoint takes care of Web/Mobile client data capture. The TCP endpoint acts as a logging server which receive logs sent by Rsyslog. Rsyslog takes care of consolidating both Nginx traffic logs, application logs and system logs. RabbitMQ is taken care by a daemon process which polls the queue as fast as it can and POSTs the data to the HTTP endpoint. This daemon resides on the same node which hosts the proposed service thus the POST method will have a very small latency. Similar logic can be applied to any other third party service by fetching the data and POSTing to the HTTP endpoint. Our HTTP service is named Bolt.
Use Existing Wheels to Implement
The third step is the actual implementation. The HTTP/TCP endpoint implementation is pretty standard and there is no point to reinvent the wheel. Logstash comes up as our top choice due to its natural fit for this use case. It provides an HTTP/TCP input [1, 2] plugin out of box. It even comes with a RabbitMQ input plugin but we decided to have our own daemon implemented and POST the data through the HTTP endpoint. The daemon is packaged with Logstash on the same node. Pipe [3] is used as the output plugin. It allows forwarding data to any customized program which is very helpful. One important fact here is to understand back pressure. If the program connected to Pipe is not responding fast enough, the HTTP/TCP endpoint will apply back pressure to the source.
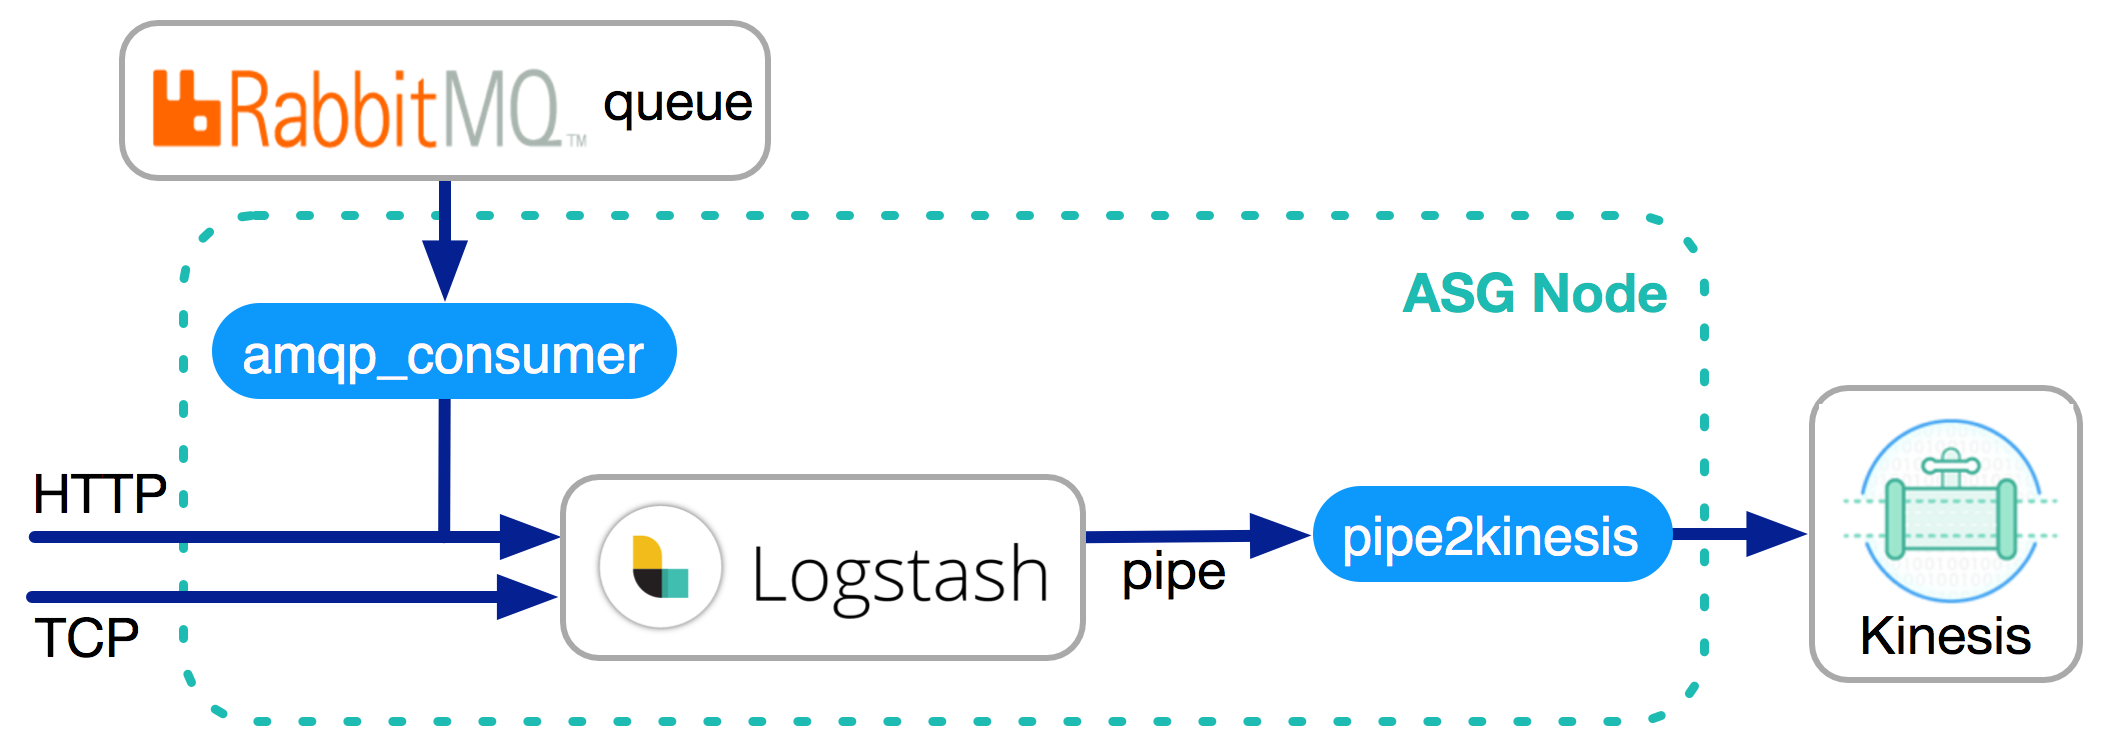
Now we have a great service that consumes real time data, it is important to take consideration of robustness and reliability. The service is stateless meaning that data simply passes through. If the downstream applications cannot keep up with the upstream throughput, there will be either data loss or back pressure applied to the source which is something people do not like to see. The standard solution is to use an elastic message queue as a buffer. In our case, Kinesis is being used. A buffer allows downstream applications to scale up when incoming data volume spikes. There are several reasons why we chose Kinesis but the most important one is the ability to seamlessly integrate with AWS Lambda functions.
The above summarizes how we implemented real time data ingestion. It has proven to be a good solution thus far. In a future post, we will explain how our data is being routed through our pipeline by using routers, which are a self-service feature that enables anyone to tap into the data we are ingesting.