Update, Dec 12, 2016: There is a follow up post discussing the outcome of all of this after the election results were known.
Suppose we set out to measure something, such as who is going to be the next President of the United States of America. It’s a fascinating and important measurement – so important that we’re impatient and try to carry out smaller, cheaper versions of the measurement ahead of time in the form of polls. We aggregate those polls into predictions like those published by the Princeton Election Consortium (PEC), FiveThirtyEight (538) or any number of others.
As of 1 am Pacific Standard Time on November 8, 2016, the PEC predicts that Secretary Clinton will win the election with 99% probability, while 538 predicts that she will win with 71.9% probability. Statistically speaking, these are incredibly different predictions even though the most likely outcome is the same in both scenarios. The two models essentially disagree on the level of uncertainty about the outcome of the election.
Josh Katz tweeted a visualization of the predictions of various outlets over time showing that the PEC is generally the most certain of the outcome of the election while 538 is generally the least certain. The PEC recently discussed this issue. How do we know who is correct?
One way would be to hold the election 100 consecutive times. If Secretary Clinton wins all 98 or 99 times, the PEC is correct. If Mr. Trump wins about 30 times, then 538 is correct. If Mr. Trump wins 70 times, then both are wrong.
Setting aside the obvious absurdity of carrying this out, as well as the philosophical questions about whether probability is best understood in a Bayesian sense (more concerned with levels of belief and uncertainty) or a frequentist sense (more concerned with outcomes of repeated identical trials) in this particular situation, we actually do have a way of running fifty separate mini-elections: the fifty states. This allows us to get some traction on this question. It may allow us to determine whether the PEC or 538 is closer to correct about the level of uncertainty in this election.
To make this clear, suppose that for each state I make one of only two predictions: Either Secretary Clinton will win with 80% probability, or Mr. Trump will win with 80% probability. That means that there’s a 20% chance for each state that I’ll make a wrong prediction in the sense that the candidate I think is the underdog wins the state. If all fifty states are independent (admittedly a big assumption), then I expect to get ten states wrong. I don’t know which ten will be wrong, only that there will be about ten.
Suppose further that when election day comes, it turns out that every single state goes the way I predicted. Hooray! I am the greatest election predictor of all time! That may be true… but a voice in my head should be whispering that I’m not such a great statistician.
The reason is that it’s very unlikely that fifty consecutive events go the way I predict when the probability that each individual trial does what I say is only 80%. This should only happen once out of tens of thousands of repetitions of the election.
What I’ve actually learned if this happens is that I should have been predicting that a given candidate would win each state with more certainty: a 90% or 95% probability rather than an 80% chance. In this scenario the outcome of the election is much more certain than I had predicted. In effect I have overestimated my uncertainty.
The real situation is a little more complicated since both PEC and 538 agree that some states are virtually certain to be won by one candidate or the other, while things are less clear in other states. Nevertheless, we can take each organization’s stated probabilities that each candidate will win each state and do a small Monte Carlo simulation to generate the distribution of the number of states incorrectly predicted by each organization.
Again, we do not know which states will be incorrectly predicted. All we know is that 538 has more states in the “competitive” range where one candidate or the other has a probability of winning from, say, 50% to 80%. Thus 538 claims a level of uncertainty in the election that will result in more incorrectly predicted states compared to the level of uncertainty claimed by the PEC.
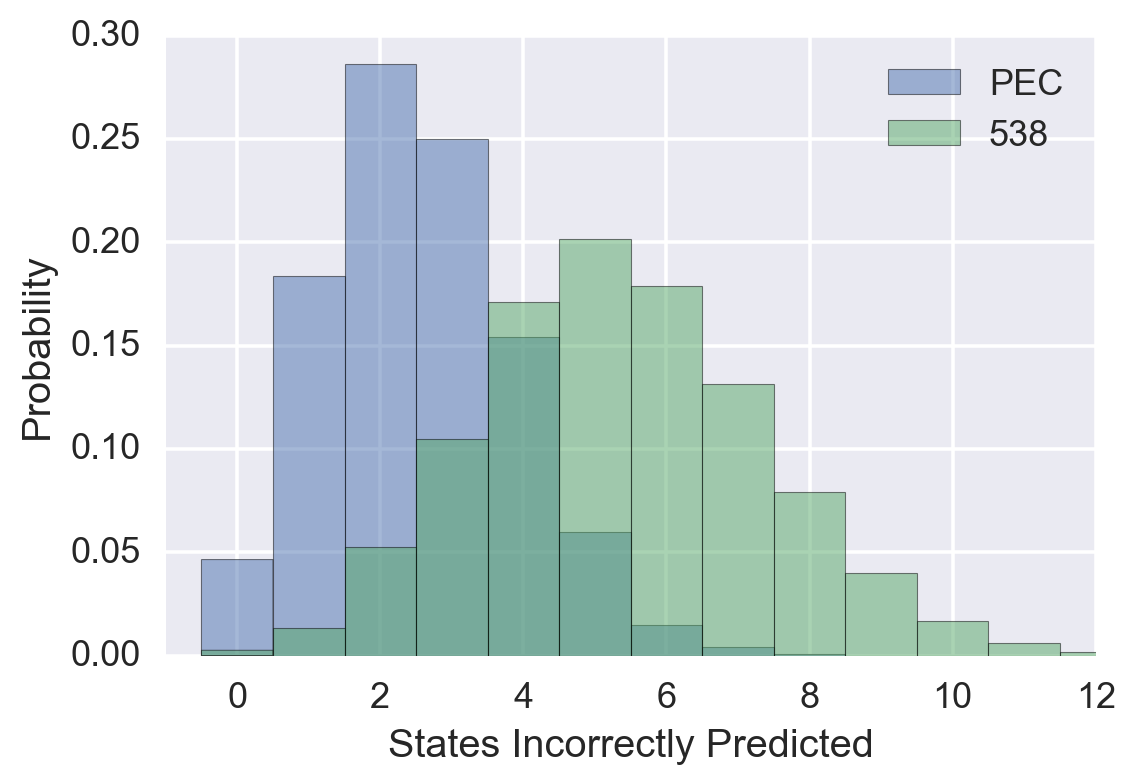
This graph shows the results of the simulation mentioned above. The most likely number of incorrectly predicted states is two for the PEC and five for 538. After the election results are in, we can compute an odds ratio for the two models and quantify which one better explains the data. Roughly speaking, two or fewer incorrectly predicted states would be strong evidence in favor of the PEC’s model while six or more incorrectly predicted states would be evidence in favor of 538’s model.
Apart from promoting pugilistic repartee among political pundits, what does all of this mean for data scientists? Estimating the uncertainty in your knowledge given a set of experimental data is an essential part of the job. The point is that if you’re doing your job correctly, you don’t want to be right all the time! If you compute 95% confidence intervals, then 1 in 20 of your claims should turn out to be wrong. If this doesn’t happen, then you’ve “inflated” the uncertainty in your modelling.
When I was an astrophysicist I remember seeing nervous researchers do exactly this by adopting “conservative error bars” when publishing results. Instead of publishing a paper that says a given galaxy has a mass between 200 and 300 billion times the mass of the sun, they would inflate the confidence band a bit and say the galaxy has a mass between 100 and 400 billion solar masses. This seems to have been driven by a fear that a more precise follow-up study with a bigger telescope would end up finding a mass of 350 billion solar masses, and then people would say “Oh, so-and-so’s paper was wrong, the mass was outside the confidence interval that they published.”
That’s an incorrect attitude toward confidence intervals. It may seem “safe” to pad your confidence intervals a bit, but all that means is that instead of computing a 95% confidence interval, you’re computing a 99% or a 99.9% confidence interval and mislabeling it.
Embrace being wrong. You want to be wrong—just not too often. If you’re not wrong often enough, it means you’re not computing confidence intervals correctly, and are therefore wrong!
Be wrong just the right number of times.
For the exciting conclusion, continue to the follow up post.