Thank you to all the 2019 summer interns that worked with the Stitch Fix Algorithms team. This post is a summary of some of the projects they worked on. We appreciate all your contributions and insights! We will soon be recruiting for summer 2020 interns.
Improving Estimation and Testing of Selection Models
Tiffany Cheng, graduate student in Statistics at Stanford University
This summer, I worked on the Inventory Forecasting and Health team, which focuses on the flow of inventory through Stitch Fix’s logistic systems, algorithmically allocating the right amount of inventory to warehouses, and quantifying the health of inventory. My work focused on estimating how many units of each item will be selected for clients on a given day.
The first part of my work focused on improving selection probability estimates for new items (i.e., the cold start problem). For example, suppose Stitch Fix adds a new women’s sweater to its inventory. How do we estimate its probability of being selected for a client when we don’t have any historical data for the item? Existing models used an average selection probability for a women’s sweater in general as an initial estimate. However, we had the hypothesis that feature-based models, which consider attributes that are often predictive of selection (e.g., silhouette, size, color, etc.), could provide a more informed initial estimate. Upon building and evaluating feature-based models, such as ridge, lasso, support vector machines, and random forest regressions, we found that their selection estimates were closer to true selection data than those from existing models, suggesting the value in the approach.
The second area of focus was designing and implementing a backtesting workflow which evaluates the performance of selection models in isolation. Historically, if we wanted to analyze changes to selection models, we ran a full backtest of the inventory forecasting system. However, since the forecasting system contains many dynamic modules, this captured errors from other sources. The new workflow allows users to identify and measure the errors introduced by just the selection model. It can be used to evaluate current selection models as well as future ones built for the forecasting system. In addition, it can inform the development of backtesting workflows for other modules within the forecasting system.

Legend: Geo-randomized Analytics
Phuong Pham, graduate student in the Department of Computer Science and Biology - MIT
When we run marketing campaigns here at Stitch Fix, we always aim to measure as much of the campaigns’ impact as we can. For some marketing channels, we can run user-randomized campaigns, which are generally considered the gold standard of experimentation. However, for other channels like radio, this isn’t possible because we can’t control who hears the ad and who doesn’t. In these scenarios, we sometimes run so-called “geo-randomized” campaigns. In these campaigns, we slice up the US into regions and then randomly (or sometimes not so randomly) choose individual regions in which we run the campaign, and other regions where we don’t. By doing so, we can estimate how effective the campaign was by comparing the two sets of regions. If we see a substantially higher rate of conversion in the regions where the campaign was run relative to the other regions, then we gain confidence that this increase in conversion is due to the campaign. Of course, this is an oversimplification. The goal of this project is to apply more sophisticated techniques to analyze these geo-randomized campaigns in an automated and reproducible way.
Over the course of the summer, I built and productionized a system to compute metrics for geo-randomized campaigns using the Generalized Synthetic Control Method (Gsynth1). In simple terms, we impute the counterfactual outcome for each treated unit using control group information based on a linear interactive fixed effects model that incorporates unit-specific intercepts interacted with time-varying coefficients1 (simple, right?) In other words, we look at the regions in the control group (where the campaign isn’t running) and use that as a baseline to estimate how the treatment regions (where the campaign is running) would have behaved if we hadn’t actually run the campaign. We can then compare these counterfactuals with the observed outcomes in the treatment regions to estimate the incremental impact of the campaign. So simple!

Multidimensional Latent Size
Hanjiang ‘Hans’ Li, graduate student in Statistics at UCLA.
An important part of recommending items for a client to our stylists is choosing items that will fit. This can be challenging; sizes vary quite a bit across brands, and no two clients of the same size share an exact shape.

We need to match clients and items in a multidimensional space using a limited number of measurements. Stitch Fix has developed size models that can predict when a client will report an item as “too big” or “too small”. We extended these models to also predict more specific feedback, like “these sleeves are too long”, or “the waist is too tight”.
In addition to height, weight, and other standard measurements we have from all clients, we ask detailed questions about the fit of each item the client has tried. The example below is from the Men’s checkout survey and shows the type of structured data we have available to model a more multidimensional notion of size.
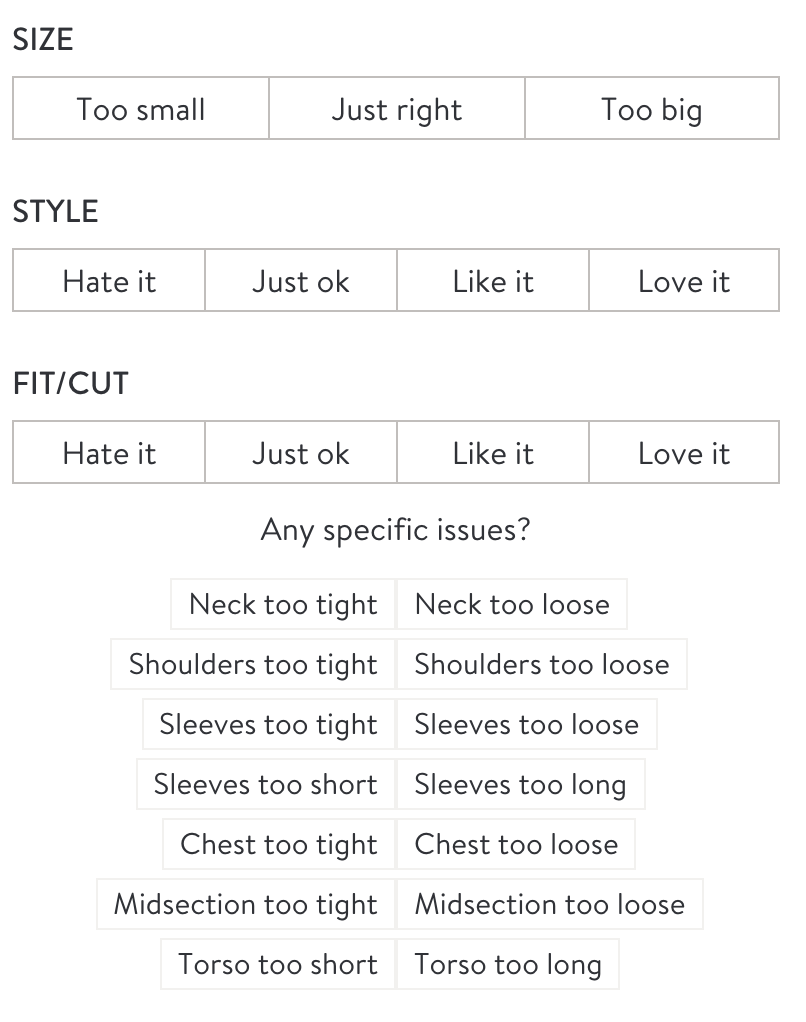
Our earlier sizing models (inspired in part by item response theory, IRT) were fit question-by-question. We had a single model to predict the client’s response to the sleeve length question. Another model predicts the client’s response to the shoulder fit question. And, so on. In this new framework, we form a joint model, able to make predictions for all of such responses. The model also allows us to directly predict size-related information in our client’s profiles, like numeric or generic top size, or whether a client prefers “Loose” or “Fitted” tops. This structural change allows us to iterate on our client on-boarding experience, enabling experimentation for various ways of asking about size and fit without tightly coupling our recommendation models to the specific questions asked.
Automated Fitting for the Demand Model
Zhenyu Wei, PhD student in Statistics at the University of California at Davis.
This summer at Stitch Fix, I worked with the Forecasting and Estimation of Demand (FED) team. The FED team builds models of client behavior as a way to forecast demand and inform strategic and operational decisions. My project focused on developing an automated model fitting pipeline as well as outlier detection.
Outlier data points were identified using a differencing method in time series to obtain a distribution of the difference between the current time period and the previous time period. A proper quantile was then chosen to identify a cutoff deviation value. We would treat data points that are above this cutoff as potential outliers. This method is flexible enough to work for the variety of different data series that are used in demand forecasting.

With regards to the automated model fitting pipeline, I also built a configuration-driven architecture for the pipeline and considered human-in-the-loop in this process. We will use this config driven framework to generalize the process to new models and new features, saving manual labor hours for the team. I also generated an email of the evaluation results to help people decide whether to update the new models to production.

Choice Set Influence on Purchasing Decisions
Arjun Seshadri, PhD Student in Electrical Engineering at Stanford University.
At the very core of Stitch Fix’s business is understanding the nuances of how clients decide to keep items in a shipment. Understanding client purchasing behavior helps our stylists and algorithms put together relevant shipments and allows us to better manage inventory. A natural way to model this behavior is to assume that the merchandise can be described by various attributes and that our clients express differing preferences for those attributes. The client decision to keep an item can then be modeled by the sum total of how well that item satisfies that client’s preferences over all the attributes. This approach, known sometimes as a factorization models, is powerful because it is very general and is fairly straightforward to infer from a limited amount of purchasing data. At the same time, such models ignore interactions between the items.
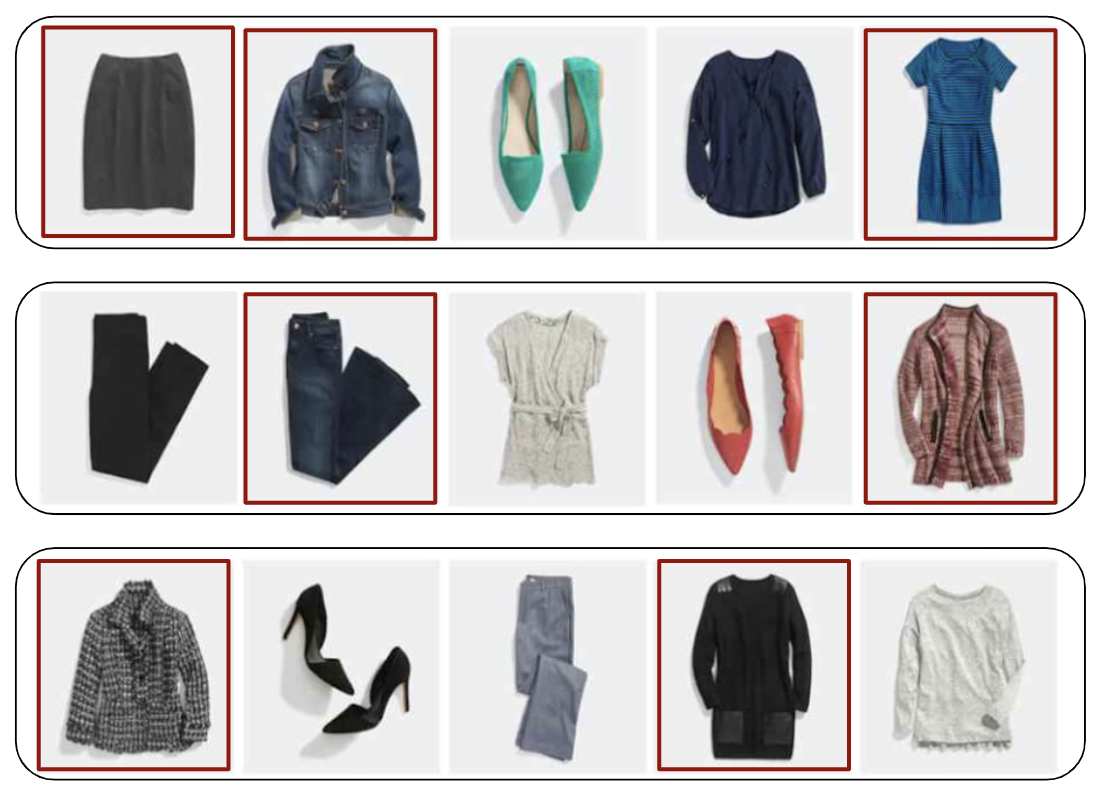
A big part of my summer internship was to explore and understand how the decision to buy an item is influenced by the assortment it is presented in. There are a myriad of reasons for why such interactions could take place. I’ll list a few examples: Clothing items are often purchased with consideration of how they will fit in with an outfit, and having two pieces of that outfit appear in the same assortment makes buying either one more compelling. Consumers are rarely looking to buying two similar pairs of jeans in one sitting, even though they may want a few pairs to pick one from, and this means multiple jeans in the same shipment are typically in competition with each other (though in some cases our client specifically request multiple pairs of jeans in order to compare them). More subtle reasons also exist. There’s a vast amount of literature in behavioral economics that suggests that some purchasing decisions are made purely as a result of the frame in which they are presented. Could a shipment be such a frame? Over the summer, I developed a modelling approach that accounts for item-collection interactions while retaining the power and efficiency of factorization models. I built a system and workflow around this new approach, which allowed me to leverage the sophisticated feature engineering of existing client purchasing models, while being able to explore and understand these effects.
References and Footnotes
[1]↩ Xu, Yiqing, Generalized Synthetic Control Method: Causal Inference with Interactive Fixed Effects Models (August 23, 2016). Political Analysis, Forthcoming; MIT Political Science Department Research Paper No. 2015-1. Available at SSRN: https://ssrn.com/abstract=2584200 or http://dx.doi.org/10.2139/ssrn.2584200