Introduction
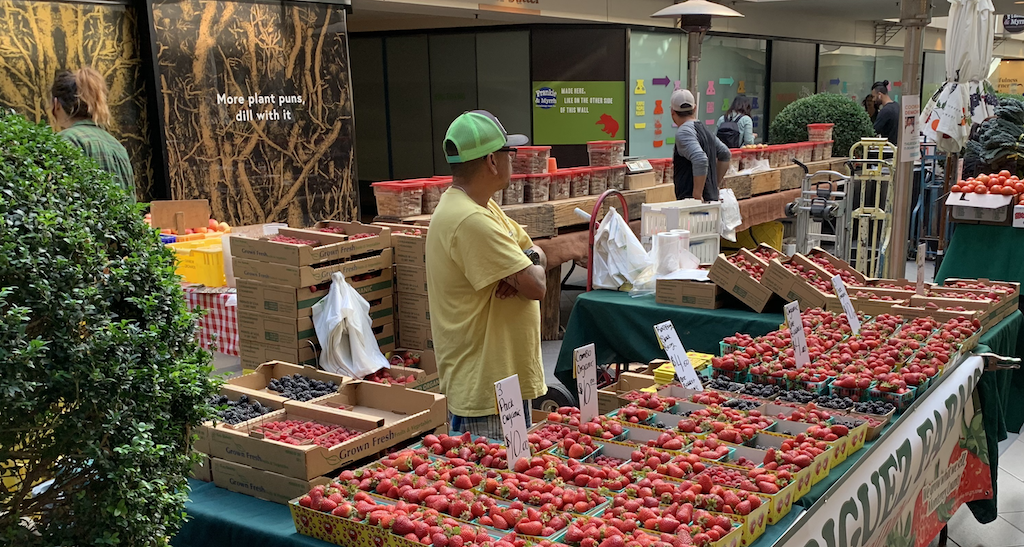
Near our offices here at Stitch Fix, there’s a weekly farmers market.
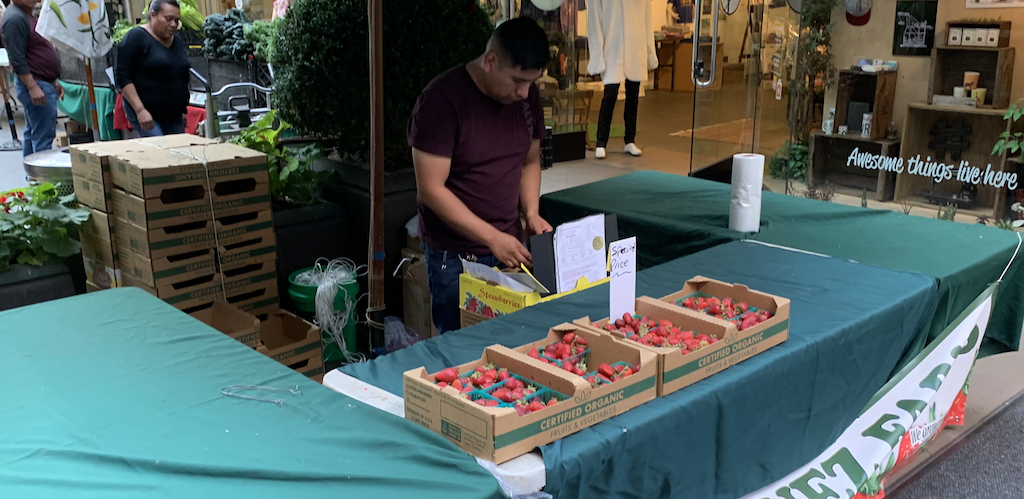
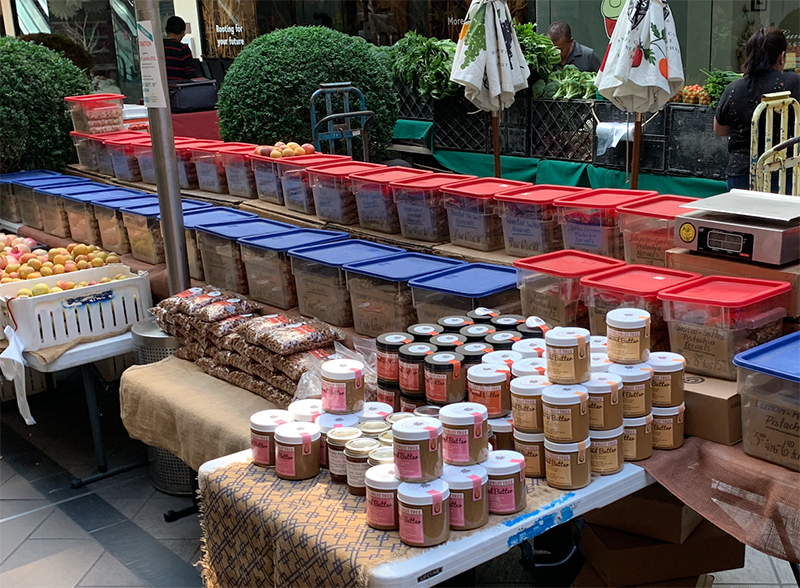
We’ve noticed an interesting pattern. When the market opens, seasonal produce, bread, and nuts fill tables and food stands. By the end of the day, however, the table with the strawberries is almost empty, while you can still select from a range of nuts at another table. Why is this the case?
Is it possible that the berry vendor constantly underestimates demand? And why hasn’t the vendor picked up on this pattern and adjusted supply to better meet demand?
We may not know the particulars for these vendors for sure, but we can use the newsvendor framing to try to better understand the tradeoffs they face every week.
The Newsvendor Model
In their blog post, Doug and Anahita [1] covered detailed formulations of stochastic optimization problems. In this post, we will present a broad framework.
The newsvendor model is a standard problem formulation in Operations Management for making optimal capacity/inventory decisions under uncertainty [2] . You might say it’s “the first formula in the textbook.” Here’s how it goes:
An entrepreneurial newsvendor buys the daily newspaper from the distributor early
in the morning.
They try to sell as many papers as they can during the day.
At the end of their shift, they salvage what they couldn’t sell.

How many papers should the newsvendor buy?

Making this decision involves finding a good balance between having too many papers vs. not having enough. Let’s introduce some notation and frame the problem.
\(c_u\!\!:\) Cost of being one unit short (typically the margin per unit)
\(c_o\!\!:\) Cost of an unsold unit of inventory (typically characterized by Original Cost - Salvage Value, or by the estimated cost of carrying inventory for another period)
\(f()\!\!:\) Probability density function of demand
\(F()\!\!:\) Cumulative density function of demand
\(Q\!\!:\) Number of units stocked (the decision quantity, with the optimal quantity \(Q^*\)).
To find \(Q^*\), we can compare the expected utility of each unit to its expected cost. Suppose we plan for having \(Q\) units, and are thinking about adding one more unit. We will then keep planning for additional inventory as long as the expected benefit of the next unit added is greater than the expected overage cost.
The \(Q+1\) st unit will be sold if demand is greater than \(Q\), with probability \(1-F(Q)\).
Expected benefit of the \(Q+1\)st item:
\[c_u (1-F(Q))\]Expected cost of the same item:
\[c_o F(Q)\]Finding the point at which the expected benefit of the last unit is equal to the expected cost gives us the optimal \(Q\)
\[\begin{align} & F(Q^*) = \frac {c_u}{c_u + c_o} \end{align}\]The right-hand side of the above equation is sometimes referred to as the critical ratio. This ratio is between 0 and 1, and it corresponds to how much of the total uncertainty to cover with the stocking decision.
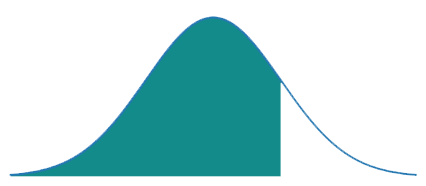
covered by the optimal stocking quantity
Products that are not perishable will have a high critical ratio, especially if the margins are high (e.g., toner cartridges, canned food, nuts, etc.). The other extreme is highly perishable products such as airline seats and fashion goods. In this case the critical ratio may well be below .5. We can think of these cases as ones where the decision maker should plan to sell out all inventory (airline seats and, yes, strawberries).
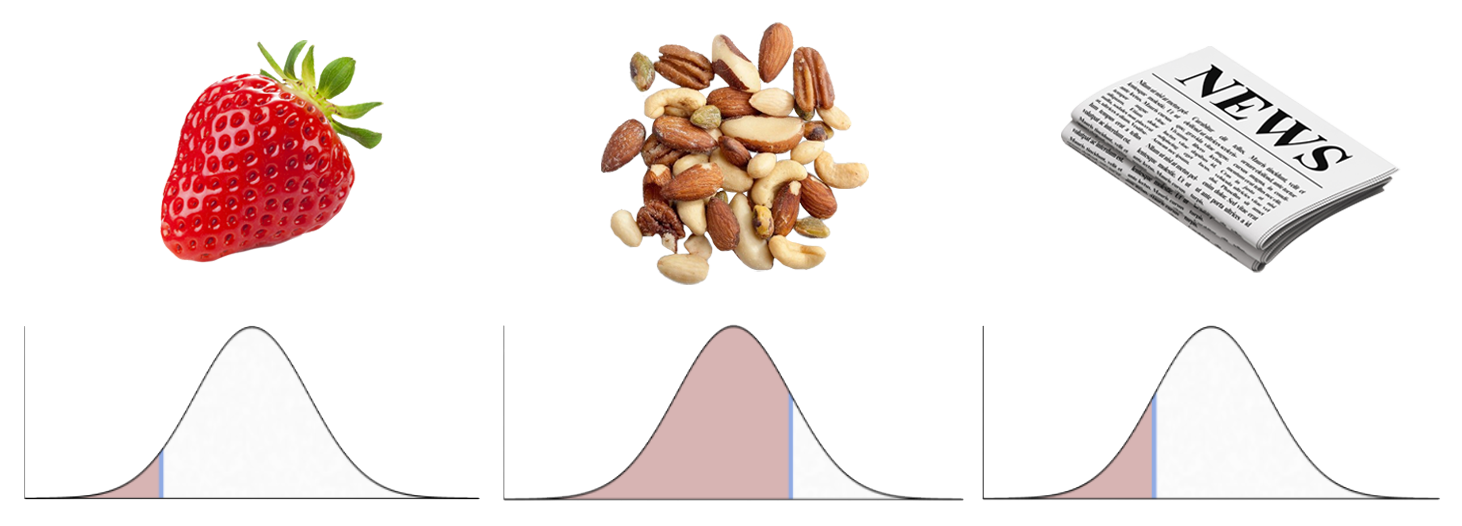
As it turns out, the risk profiles (demand uncertainty, overage, and underage costs) of the nut vendor and the strawberry vendor are pretty different just based on perishability (overage cost) alone. The strawberry vendor likely wants to run out of inventory before the end of the day: what is unsold is probably not going to be worth bringing back to the next market, while the nut vendor can easily sell unsold inventory on a future day.
Applying the Newsvendor Formulation
Estimating the cost of underage may be relatively straightforward for most companies — missed profit opportunity is a good first estimate. Complexity may increase if effects of client retention may need to be qualified (customers who switch to another brand tend not to come back, and now underage costs may be greater than the profit margin). Additional complexity may arise when the effects of substitution need to be included (vendor runs out of inventory but some of the customers switch to an equivalent product that may be in stock resulting in underage costs that may be less than the profit margin).
Estimating the impacts of overage may end up being pretty involved as well. Cost of capital (opportunity cost of not using the capital elsewhere) and the cost of carrying products in inventory for another cycle are good starting points, but this approach may miss additional costs of overage. 1
For example, product returns and obsolescence costs may be hard to quantify, especially when obsolescence costs only occur when the product is cleared. It may be hard to convert this to a figure used for weekly decision-making.
Estimating the range of demand over the decision period almost deserves its own blog post. For this post, let’s assume that we can have a range of demand scenarios from historical data that enables a rough understanding of the demand distribution. Note that it is very important for companies to operate on a range of values rather than a point estimate. 2
Overage and Underage Tradeoffs Are Everywhere
At Stitch Fix, we face the manifestations of the newsvendor problem all the time, both for short- and longer-term decisions. Here are some examples.
CAPACITY PLANNING: For each day, we plan our styling and warehouse labor and shipping capacity. Overage is having idle human capacity; underage may mean delays, expediting, and unmet client expectations.
MERCHANDISE PLANNING: For each season, we plan for and buy seasonal merchandise. We strive to find the sweet spot between potentially having too much of something vs. running out. Underage is running out of a very popular style; overage is capital and warehouse capacity tied to inventory that ended up being unproductive.

The first formula in the textbook is sometimes the hardest to implement
In his excellent book, High Output Management [3], Andrew Grove introduces indicators, or measurements, as key tools for management towards operational goals:
“If, for example, you start measuring your inventory levels carefully,
you are likely to take action to drive your inventory levels down,
which is good up to a point. But your inventories could become so lean
that you can’t react to changes without creating shortages.”
We can think of these, as factors companies care about and optimize for – they direct attention to what they monitor. Grove highlights the importance of pairing indicators so that both effect and counter effect are measured (e.g., monitoring both demand shortages and inventory levels).
The newsvendor formulation is a great approach to find a good balance between two factors that move counter to each other: Revenue vs. Cost, Customer Service vs. Efficiency, Inventory vs. Shortage.
Things get interesting if the competing indicators are the key metrics for different departments. It’s pretty typical that in traditional companies that source/make/sell products, departments are not closely coupled. Demand-facing departments are primarily measured against revenue, conversion, and client growth targets, while Procurement, Manufacturing, and Supply Chain organizations primarily focus on higher efficiency and cost reduction.
It’s challenging enough to improve a single business metric as a data scientist. Things do get more interesting when one aims to find the sweet spot within competing factors such as service vs. efficiency. In addition to the right models, algorithms (simple as they may be), and infrastructure, you will need to ensure that the right conversations are happening between the stakeholders and that the tradeoffs between competing metrics are made clear across the company.
The following engineering “law” [4] is still very much on point when interfaces are between organizational silos:
“The ability to improve a design occurs primarily at the interfaces.
This is also the prime location for screwing it up.” Shea’s Law
At Stitch Fix, the Algorithms team is a standalone organization. This enables us to not only work on a range of interesting problems (marketing spend optimization, conversion optimization, warehouse capacity, and freight cost optimization), but also to identify the cases in which the key business tradeoffs may span multiple departments. More and more, we act as the interface.
If you are a practitioner, here are a few questions that may help you better understand your surroundings:
- What is the primary goal of your group? (e.g., what do you optimize for?)
- What are the counter effects of your optimization? (i.e., what are the counter indicators?)
- Where does your group report to? To a business function, or to a centralized function?
Footnotes
[1]↩ Marking down product to sell through the remaining inventory is typical. However, when this becomes too typical, consumers start expecting the sales and this has implications for the brand image.
[2]↩ Especially because point estimates may change periodically, incorporating a range of scenarios in decision-making enables highlighting when and where there may be demand and supply mismatches. (We call this scenario-based planning.)
References
[1]↩ Moving Beyond Deterministic Optimization by Anahita Hassanzadeh and Douglas Roud
[2]↩ Production and Operations Analysis by S. Nahmias
[3]↩ High Output Management by Andrew Grove
[4]↩ Shea’s Law: https://spacecraft.ssl.umd.edu/akins_laws.html
Further reading, with some examples of overage costs from the personal computer business: Inventory-driven Costs