Note: we understand that there are more important topics in the world given that we’re in the midst of a pandemic, and we wish for everyone to remain safe & healthy. We’re continuing to publish blog posts in the hope that they provide a sense of connection and a signal of continuity—while it's difficult to think beyond the day, together, we will get through this.
The problem
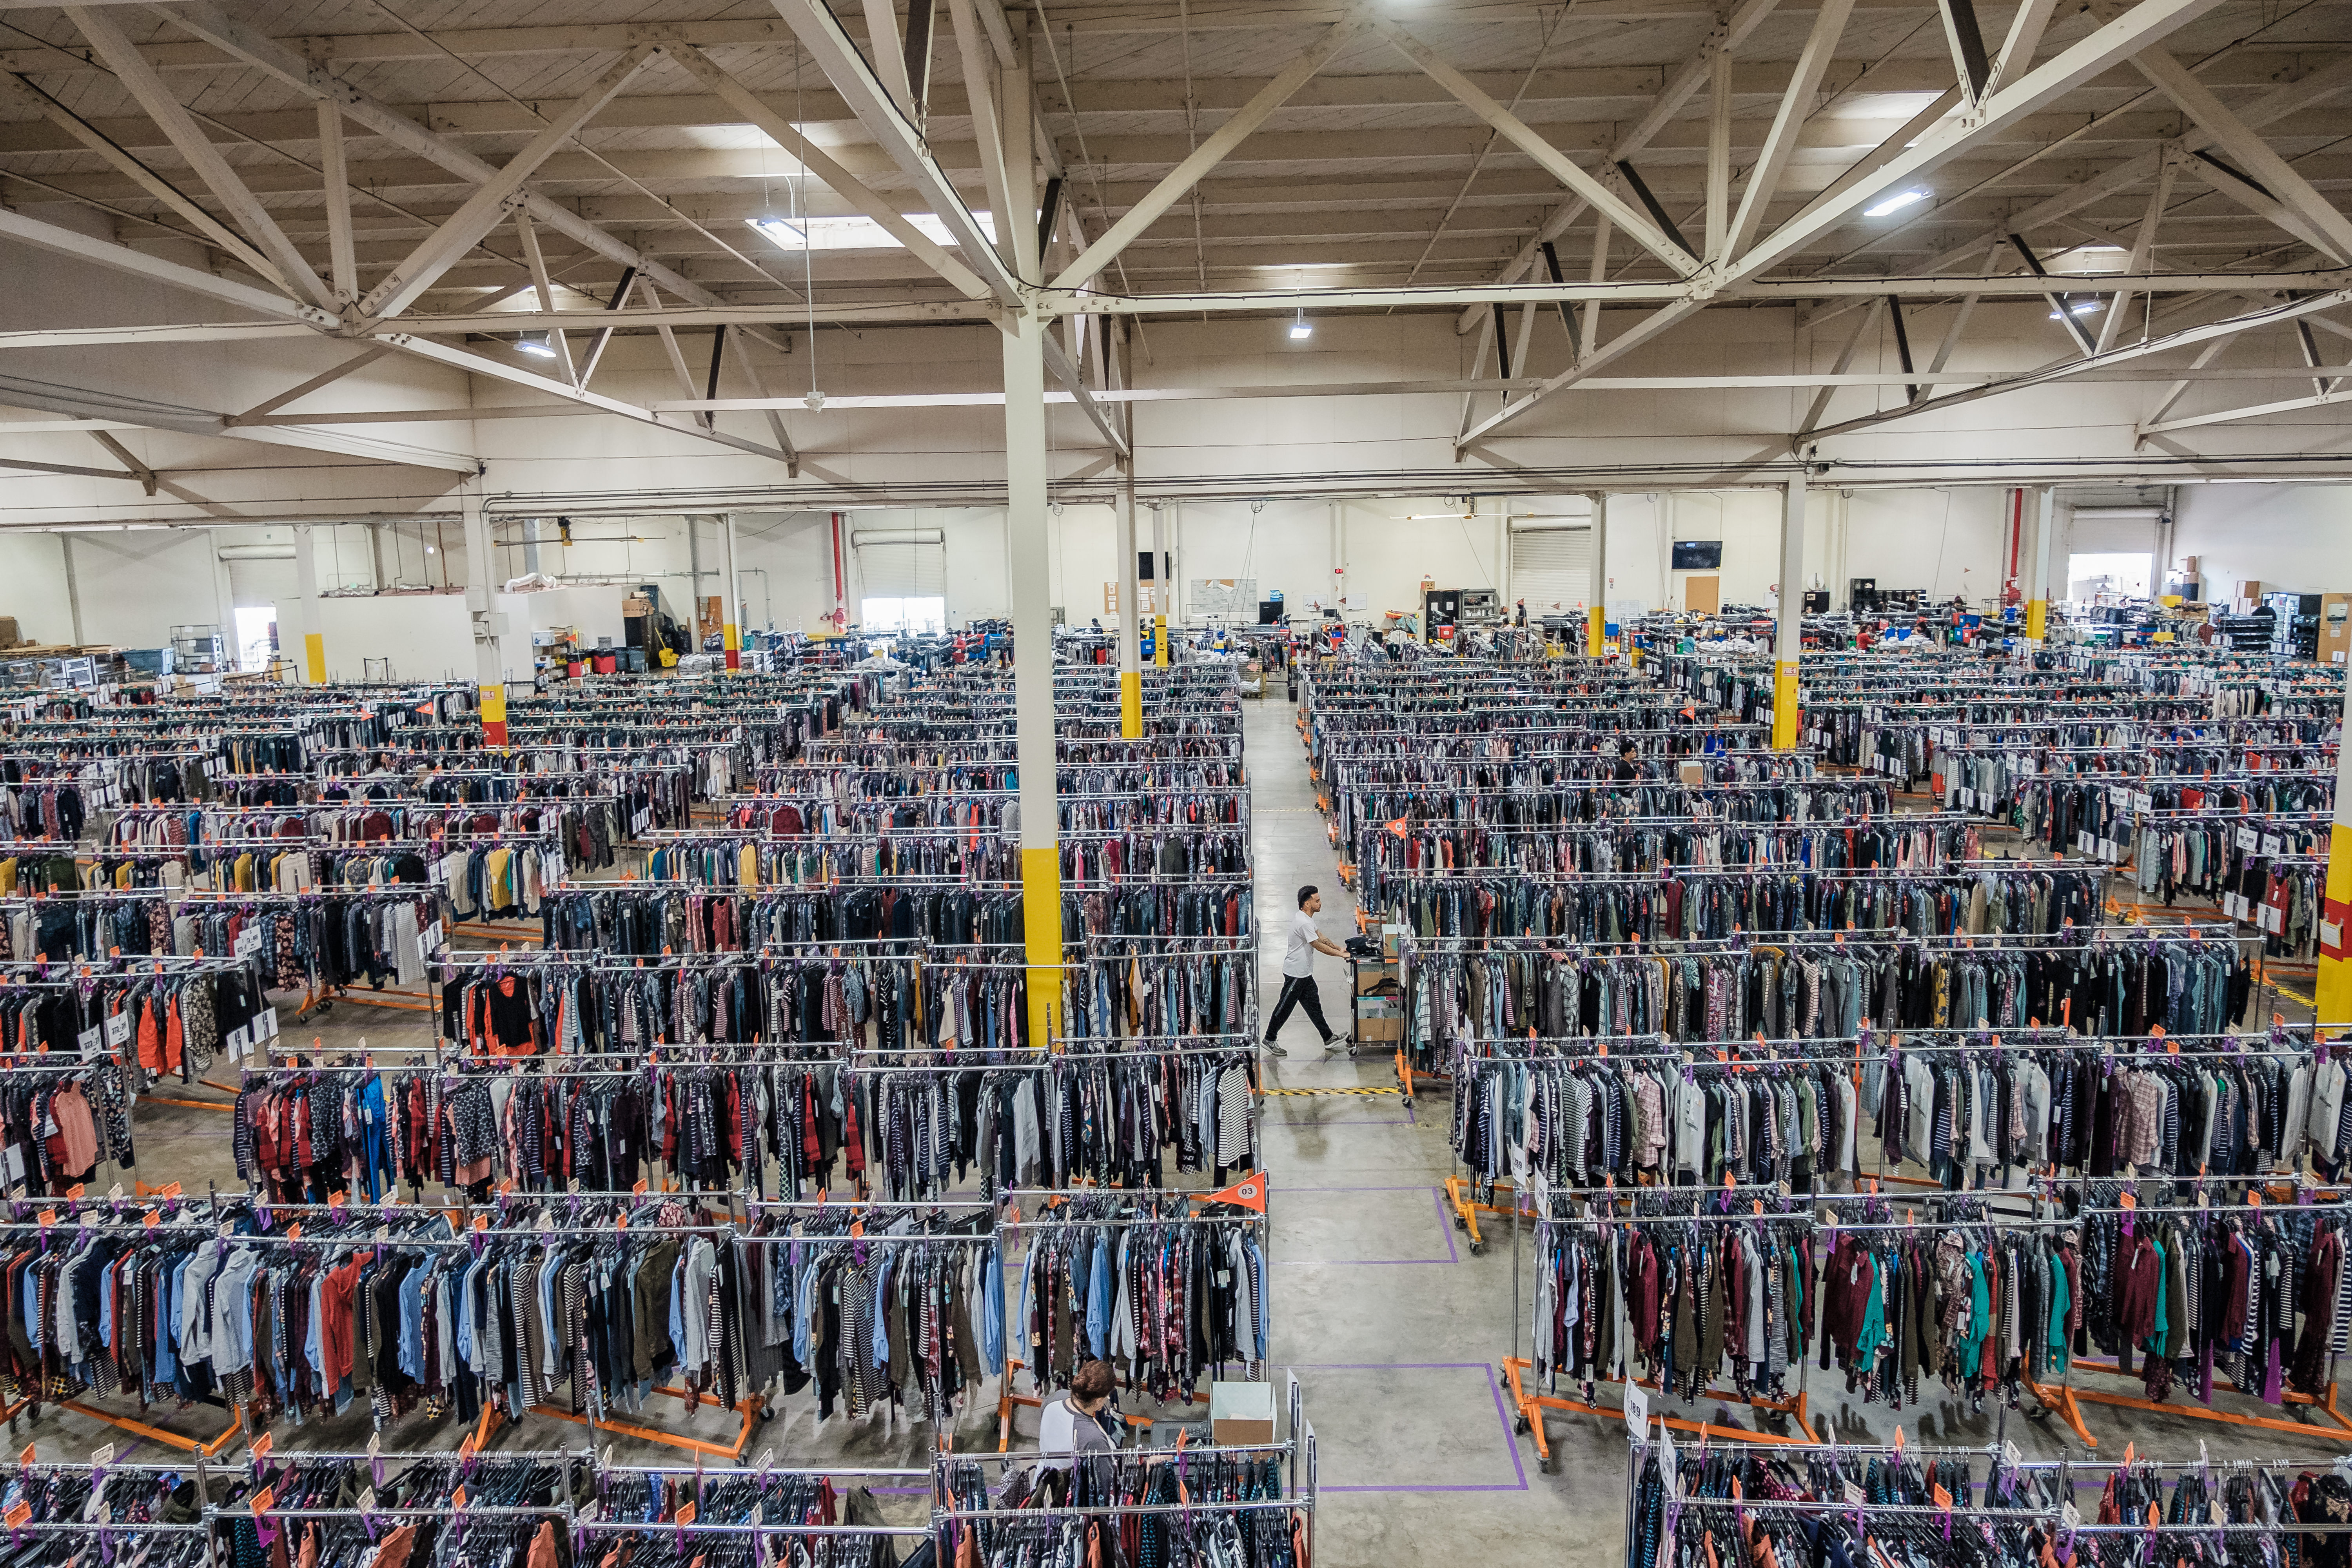
We’ve written before on this blog about how our Algorithms team works to make our warehouse operations as efficient as possible. A warehouse is a vast space that requires careful organization. The starting point for our warehouse organization is to subdivide the space by business line (Women’s, Men’s, Kids’) and then by size (e.g., S, M, L).
The shipments we send to our Stitch Fix clients typically consist of five items, though this number jumps to ten for our Kids’ business. It wouldn’t be very efficient to send our warehouse workers around collecting—“picking” in warehouse operations jargon—just the items needed to pack and ship a single shipment; this is due to the fact that a substantial portion of picking time is just the journey to and from the packing base area. Thus, our first step in improving the efficiency of our warehouse picking operations is batching: that is, an algorithm to optimize the grouping of shipments into batches of an appropriate size for one pick path, where this size is a constant determined by business line (Women’s, Men’s, or Kids’). After the batches are constructed, we run a pathing algorithm to determine a good[1] sequence for the picking of the items in each batch.
As our business has grown, we are experimenting more and more with improving our warehouse operations. For example, we’re experimenting with different ways of laying out categories and sizes of merchandise in our warehouse. The warehouse layouts themselves[2] have thus become a more frequently changing input to the batching and pathing algorithms. And what comes with increased complexity in the inputs to algorithms? Increased surface areas for bugs.
Bugs in the batching and pathing algorithms have happened, and they can be fairly catastrophic to a warehouse’s productivity, so it is extremely important to try to catch and fix bugs as early as possible. Before we built the app that is the subject of this blog post—Tourist is its internal code name—the steps to discovering a bug in batching and/or pathing were as follows:
❗ Warehouse employees suspected something was up because of batches with paths that seemed extraordinarily long and/or inefficient.
🔊 A warehouse lead communicated this to the Operations team.
✉️ Someone from Operations opened a ticket with the Engineering team that owns our internal warehouse applications that surface batches and their associated pick paths.
👷🏿♂️ An engineer did a first pass at bug-hunting in the warehouse application code, then escalated to the corresponding Algorithms team[3] if there was no obvious source of the perceived problem.
👩🏽💻 A data scientist dove into Algorithms-owned code to figure out whether a bug in an algorithm (served as an API to the warehouse application code) was the cause of “weirdness” reported by the warehouse.
If there was no bug, the data scientist communicated that back to their Operations business partner, who communicated the same result back to the warehouse. If there was a bug, then the scientist fixed it and communicated back through the same chain when the fix was completed.
The (likely obvious!) pain in this flow was the inability of Operations team members to triage warehouse reports of potential problems themselves. It left them relatively powerless, only serving as messengers, and it also caused pain for the engineers and data scientists whose work was somewhat frequently interrupted by tickets and requests to investigate potential bugs. This would have been less of a problem if reports from the warehouse had a very high correlation with the occurrence of actual bugs, but in reality, it happens fairly frequently that some sets of shipments are very difficult to batch efficiently (given the warehouse layouts at the time), and so what feels like a “bad” batch is actually the best solution we could deploy, and there is no bug. (We’ll dive into exactly what combinations of shipment and warehouse layout features have caused this below.) In addition, the metrics used by data scientists to make an initial assessment of a batch’s goodness are relatively simple to calculate.
Thus, we decided it was time to put together a web application for Operations, warehouse Engineering, and Algorithms team members to be able to easily look up a batch to see its pick path and all relevant related metrics. All stakeholders can now use Tourist to do a first pass at investigating reports of potential bugs from the warehouses. And as this kind of visual troubleshooting is applicable in many business domains—ride-sharing and deliveries jump immediately to mind—we thought we’d share a bit about our (quite simple!) design.
So what does Tourist look like?
The landing page for Tourist is a simple input to look up a batch via the id of one of its constituent shipments[4]:
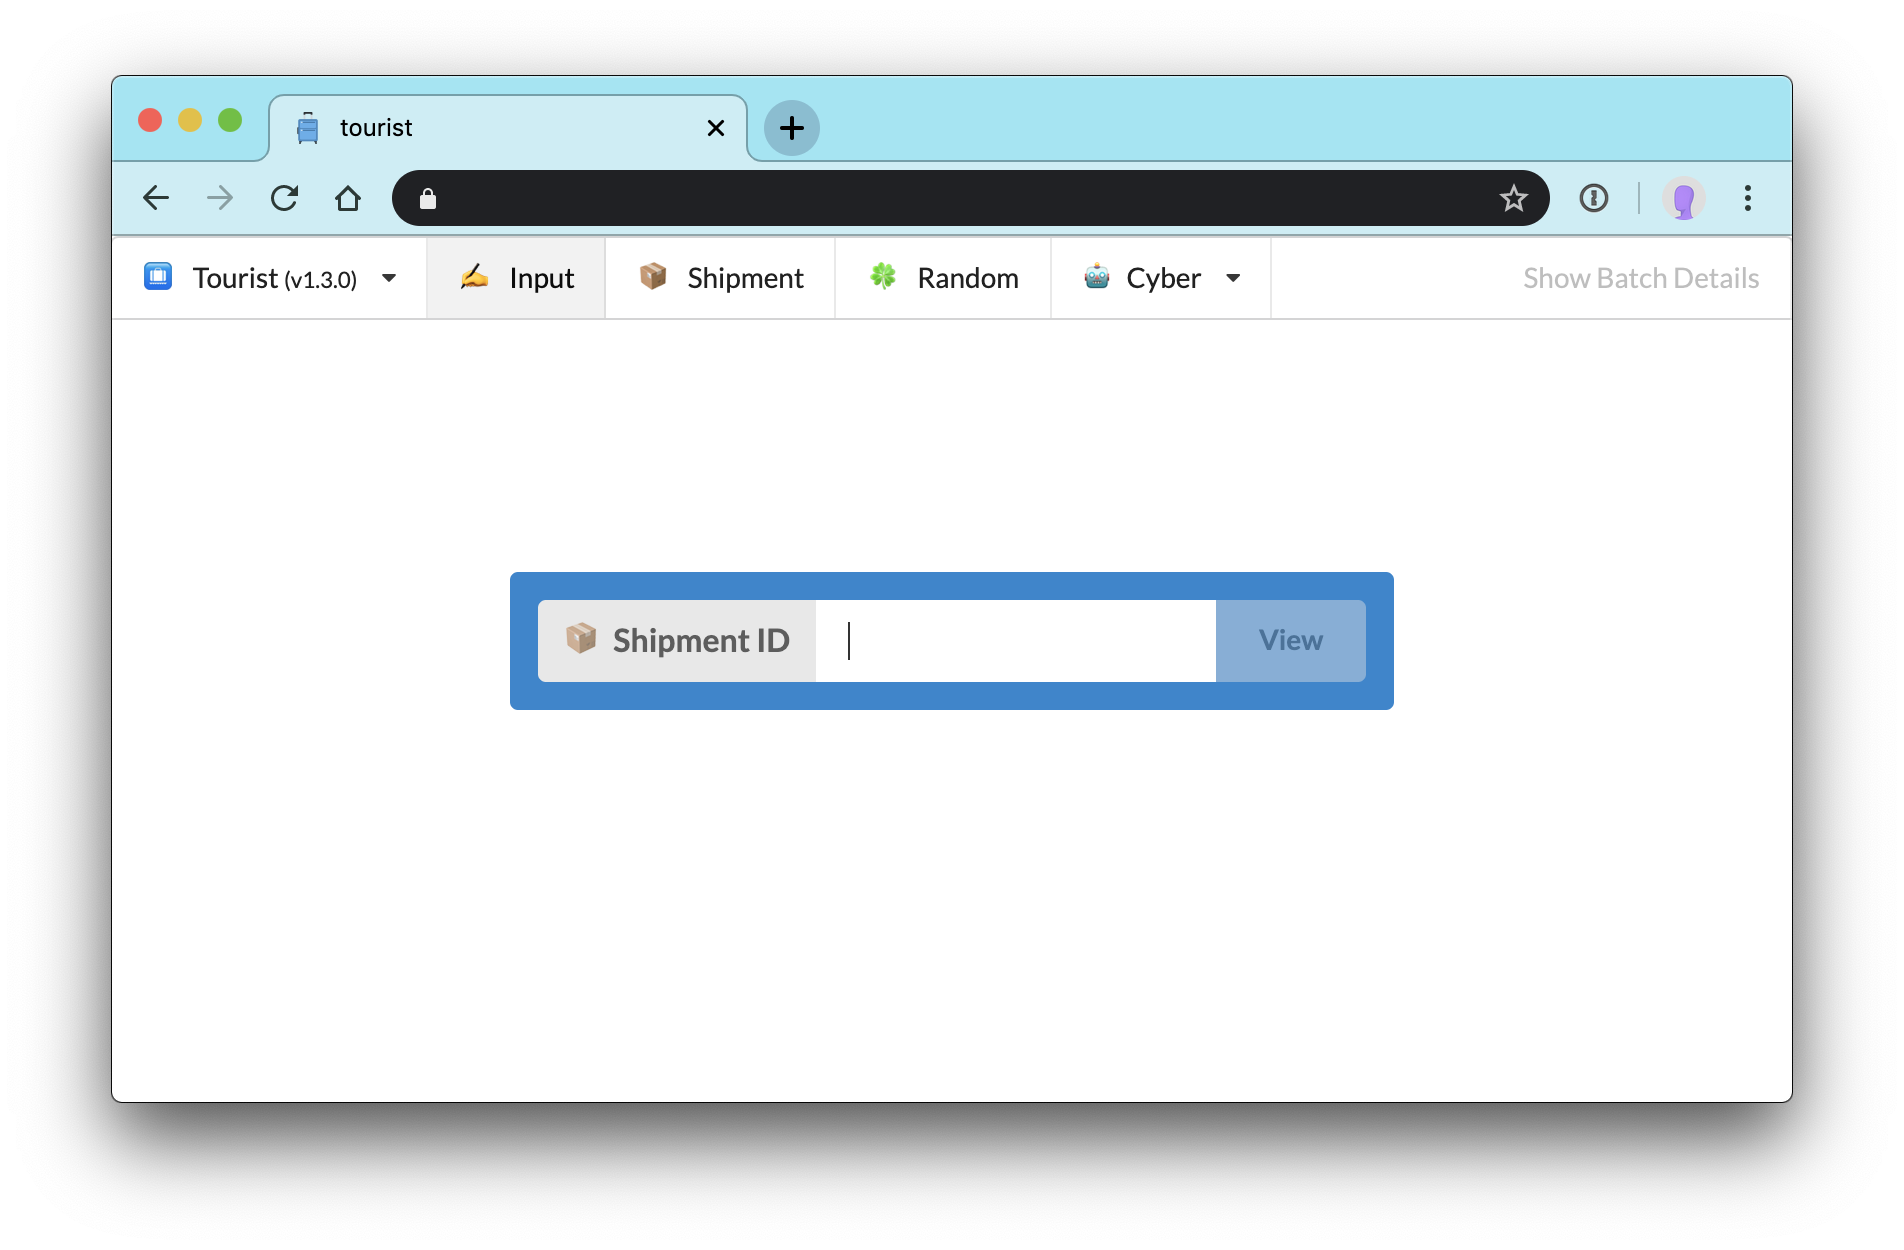
This fits the intended primary use of in-the-moment debugging based on reports of “weird” batches coming down the line from warehouse leads.
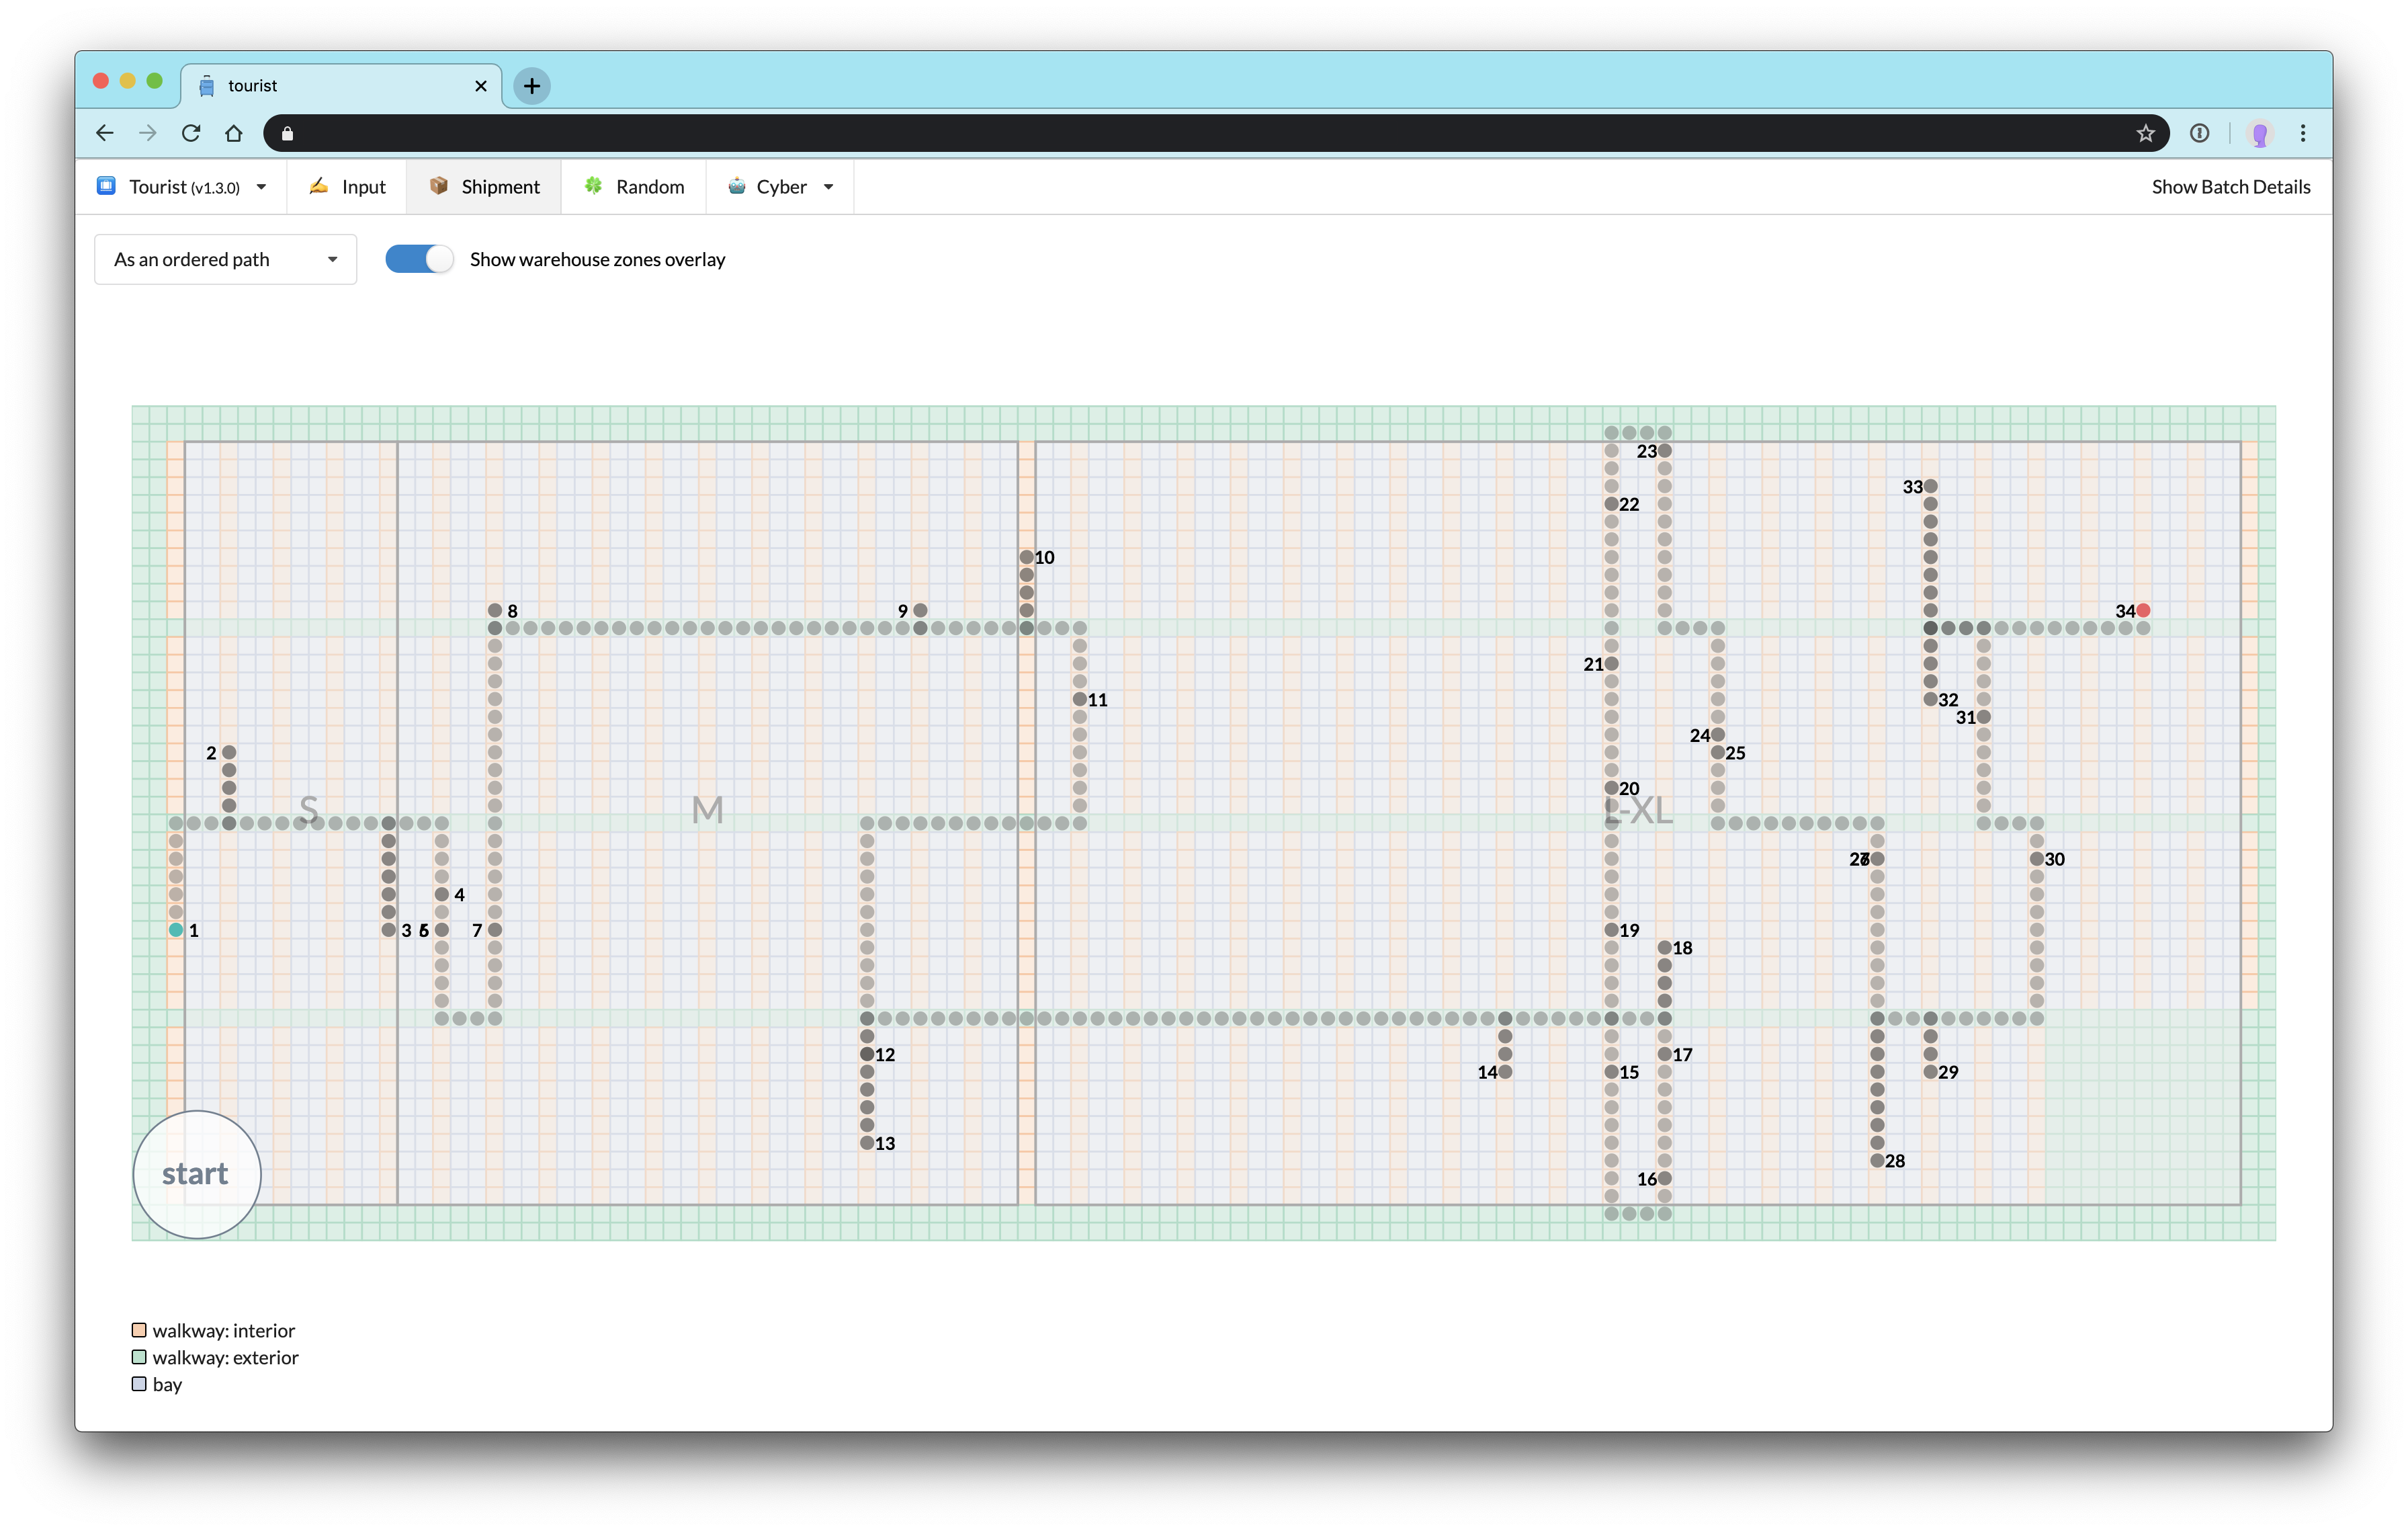
Once we’ve retrieved all the necessary data for the batch as well as the warehouse (the layout of the relevant business line-specific slice of the warehouse, most importantly) we display the batch as its pick path for the user:
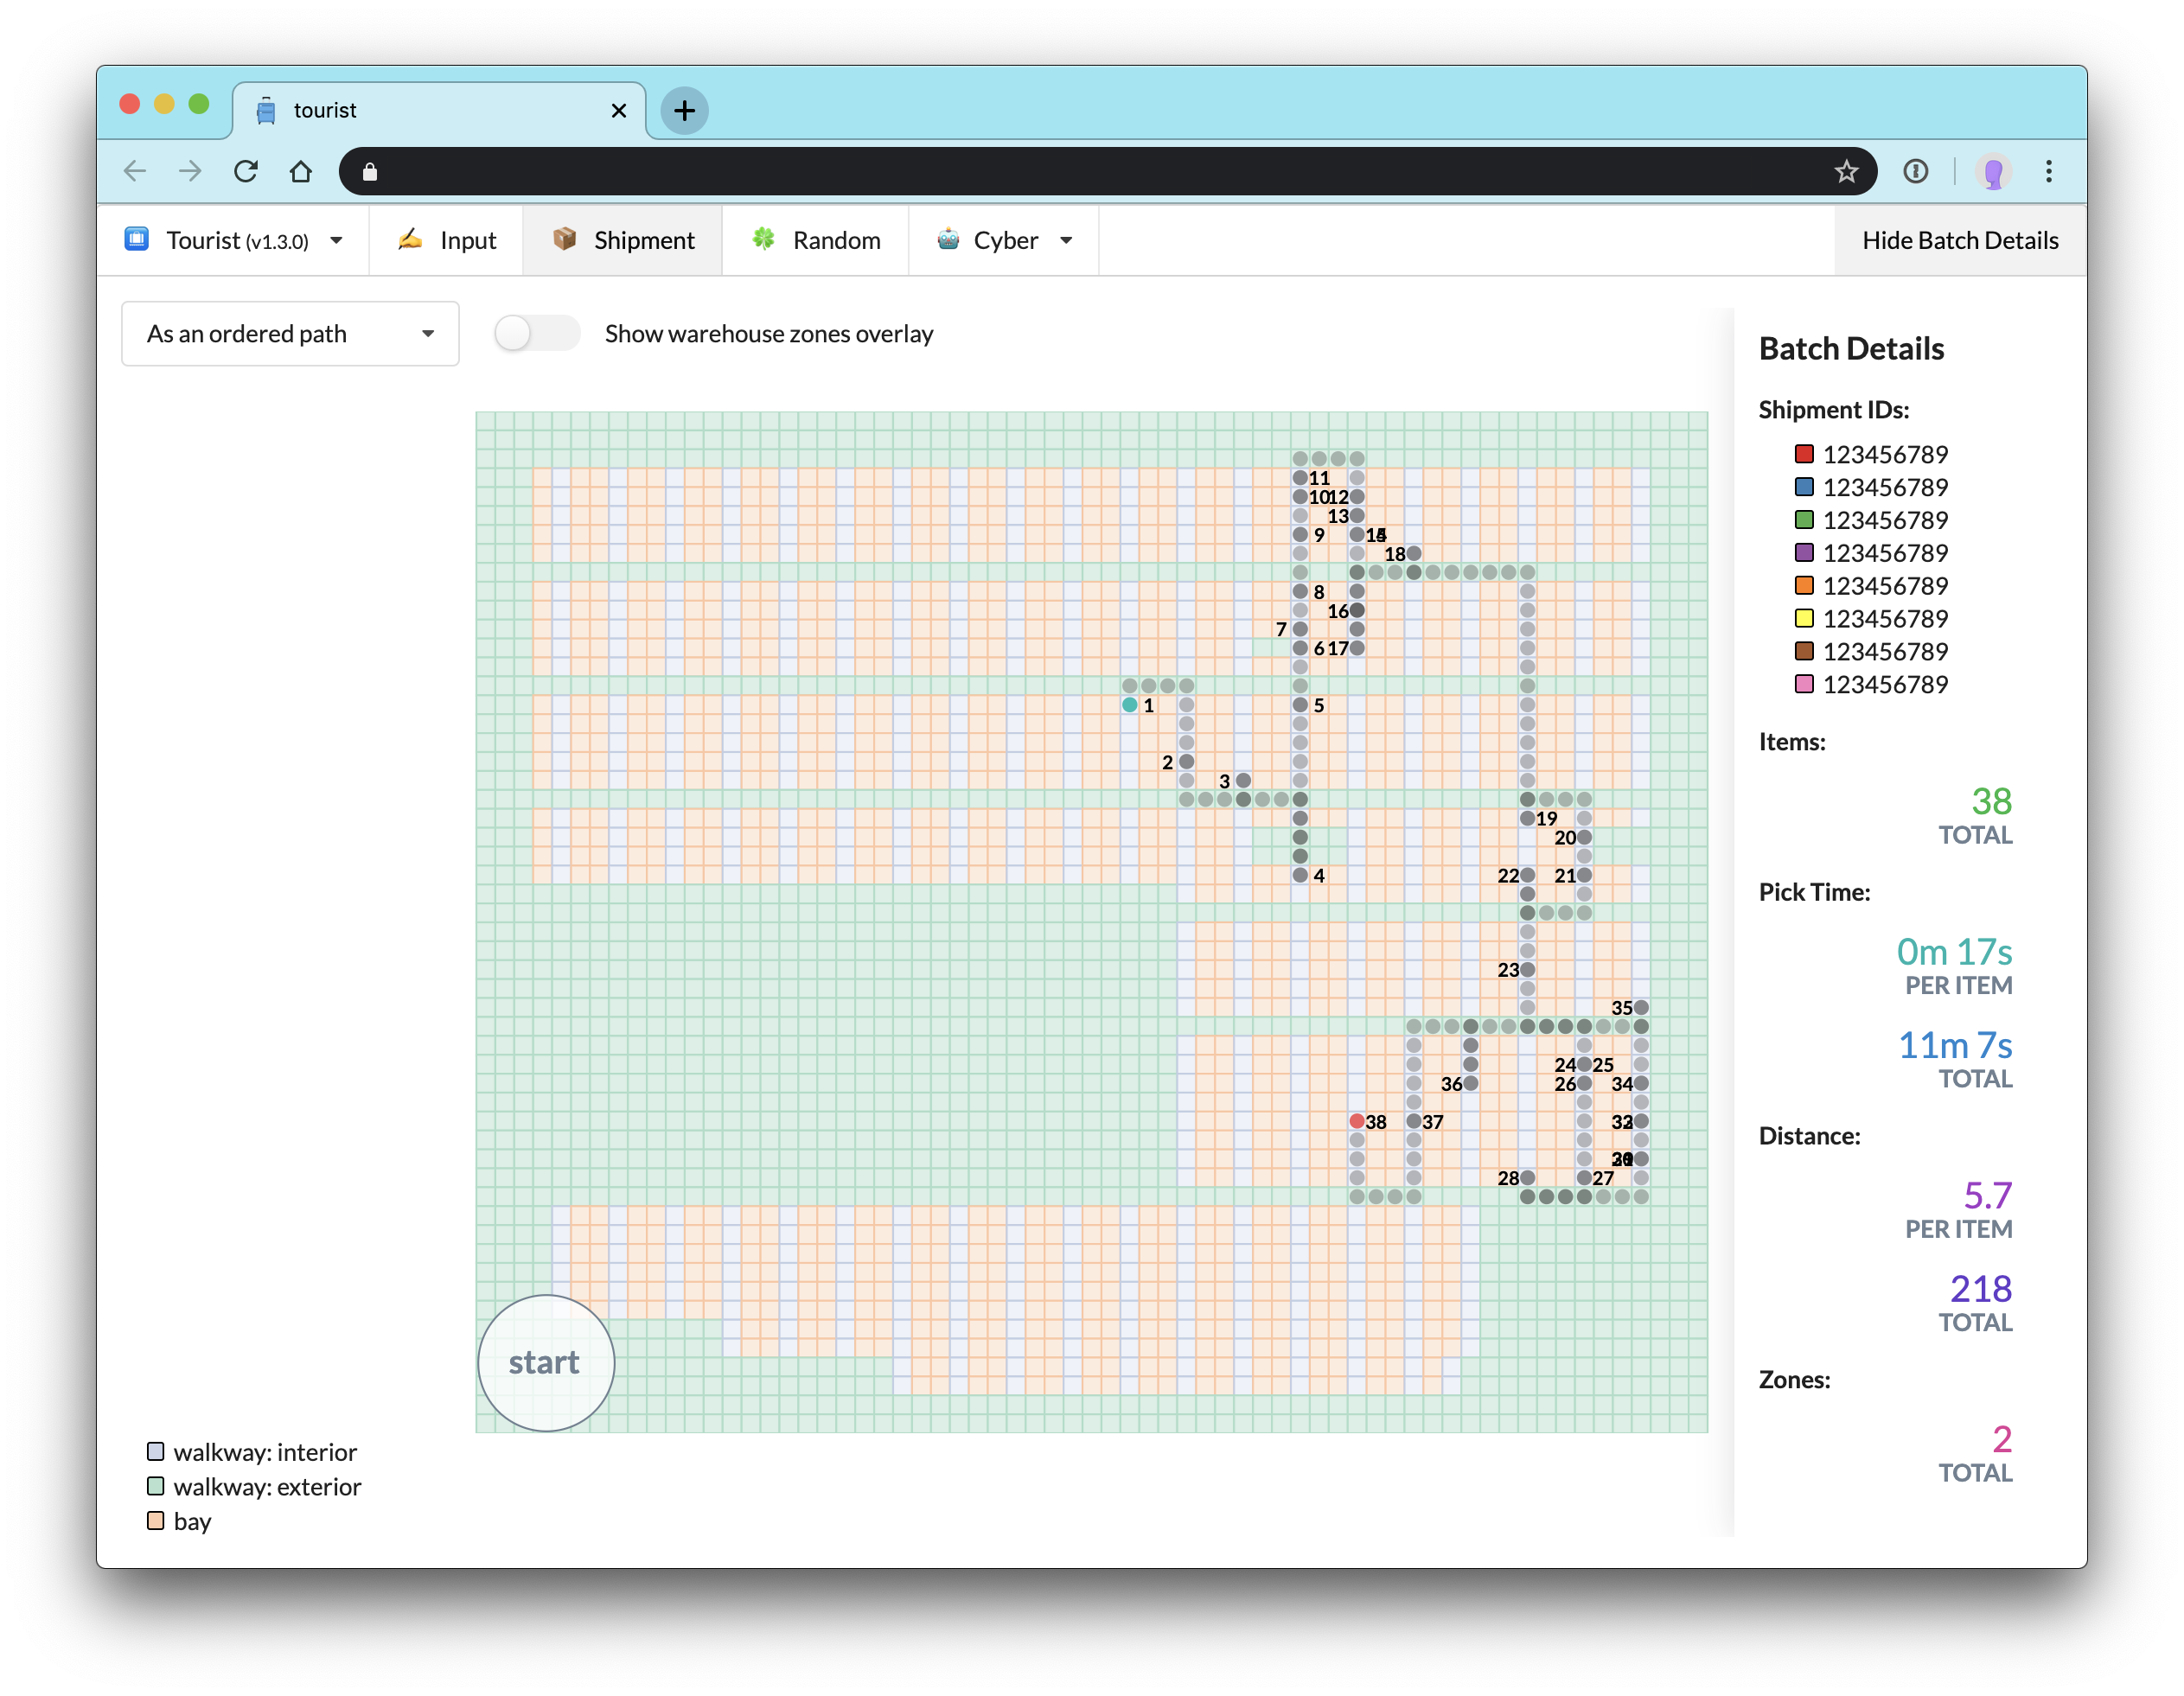
Let’s zoom in and examine this visualization in detail:
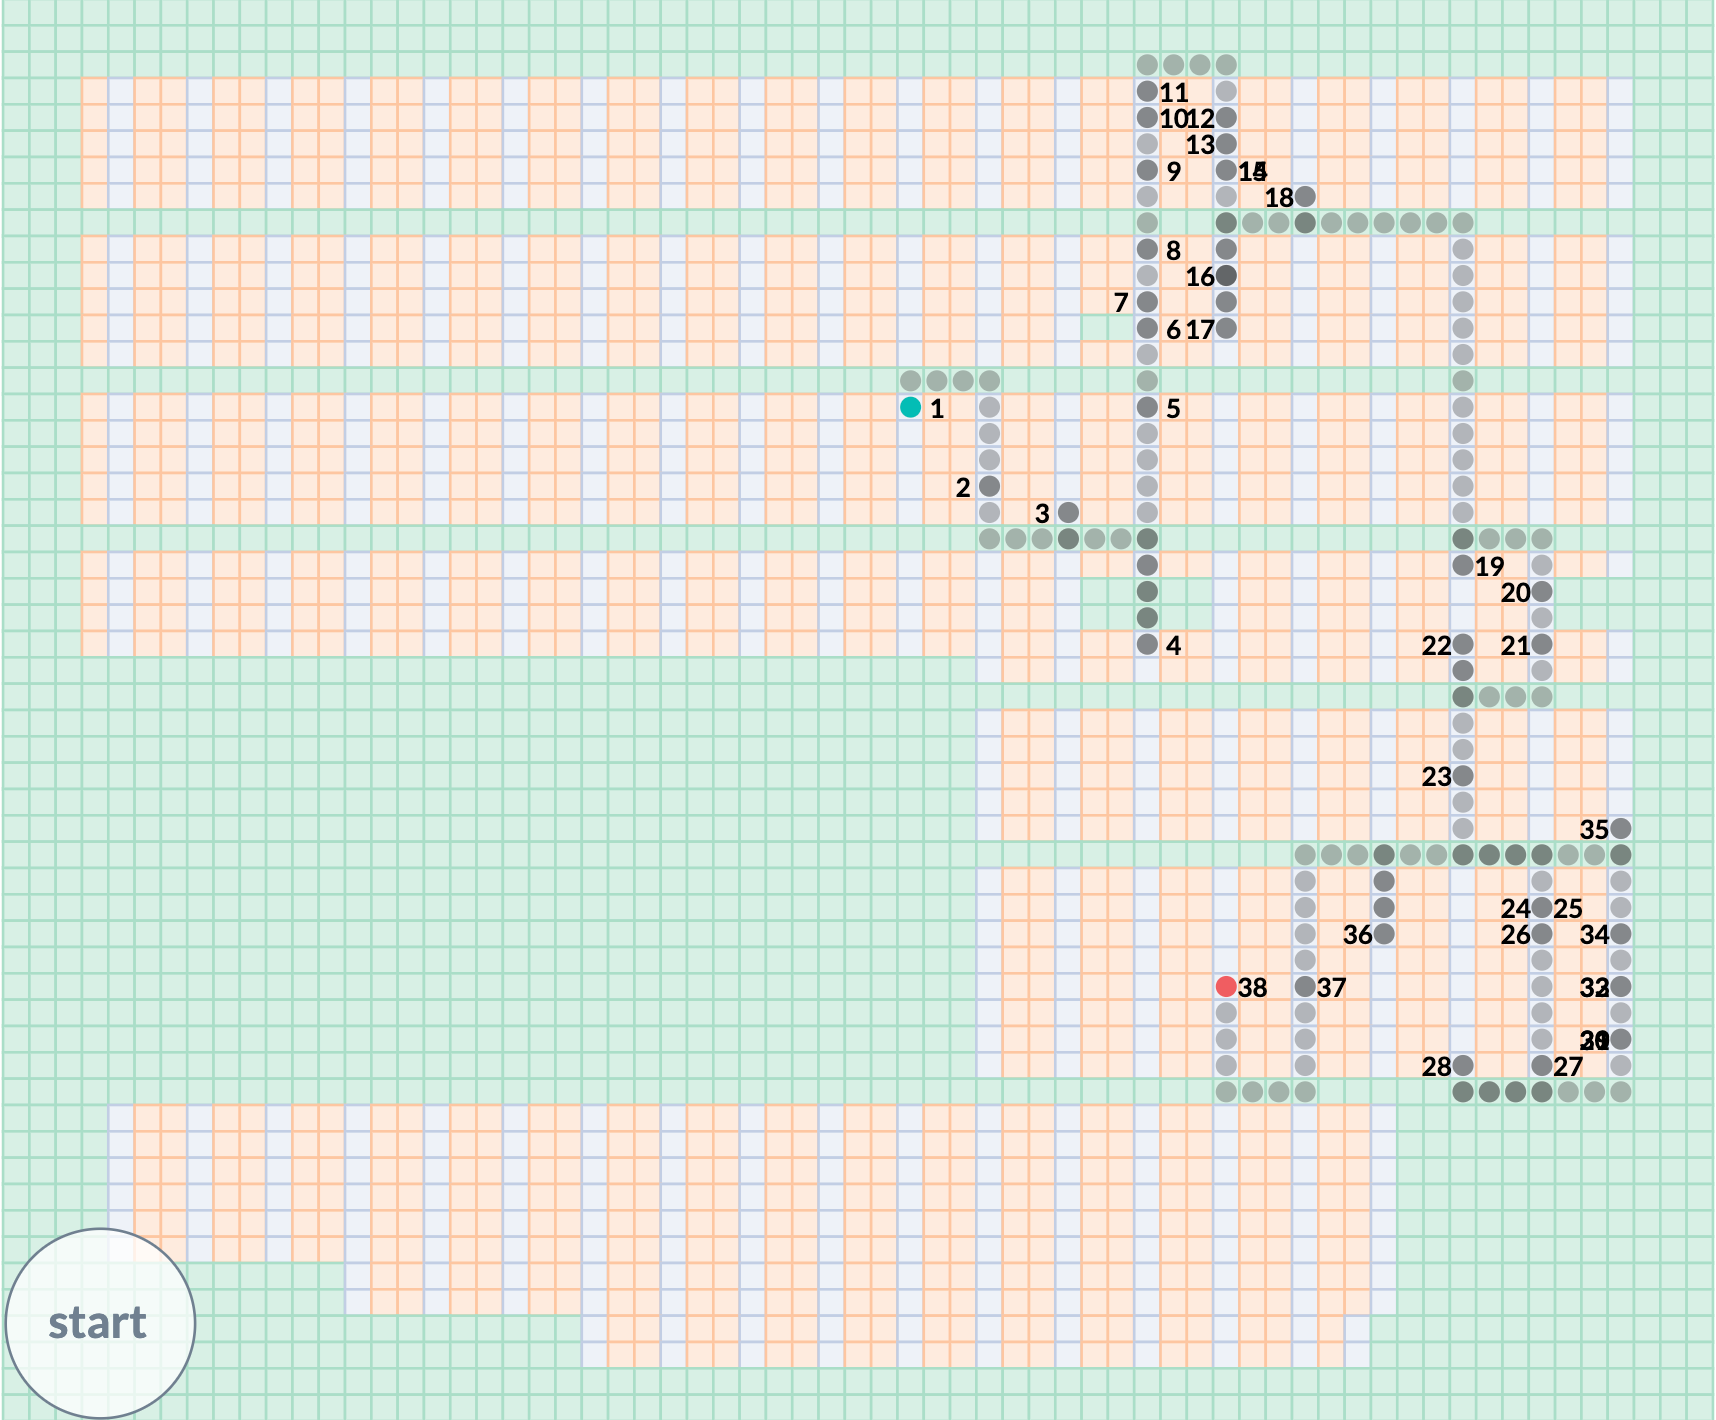
The path begins with a green circle and ends on the red. Each semi-transparent grey circle represents a warehouse unit “step” in the pick path. When the picker had to retrace his or her steps, multiple circles will be layered on top of each other, resulting in a darker path segment. This has the useful side effect of making a bad pick path extremely obvious:
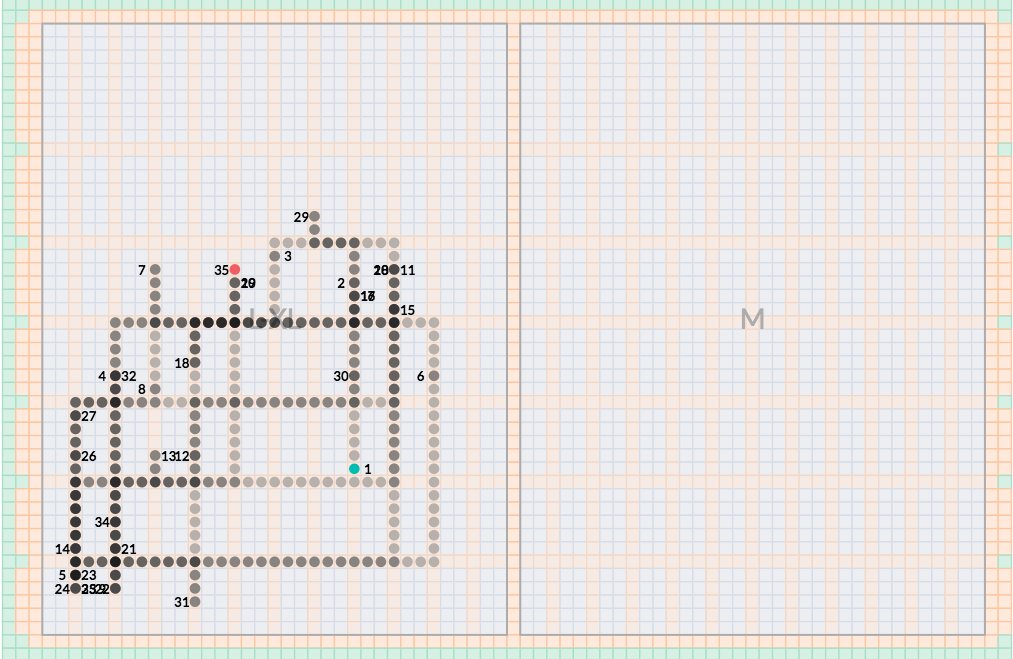
The numerals represent both the location and ordered index of each picked item. Some numerals overlap and become unreadable, but that’s only a minor visual annoyance. The numerals serve mainly to provide the user with milestones that indicate the ordering of the path; thus not every numeral need be legible. In the case of very tightly packed paths where the ordering is difficult to visually parse, the user can click the “start” button in the lower left corner to animate the path:
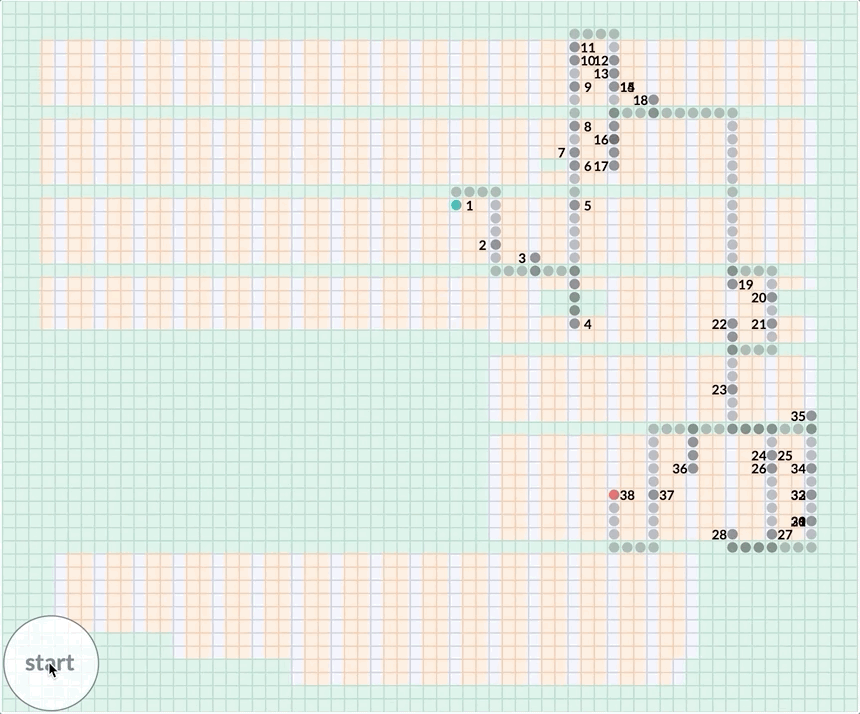
A dropdown menu provides a couple of other ways to view a batch, including as just a collection of circles representing the items in the batch, color-coded by each constituent item’s shipment id:
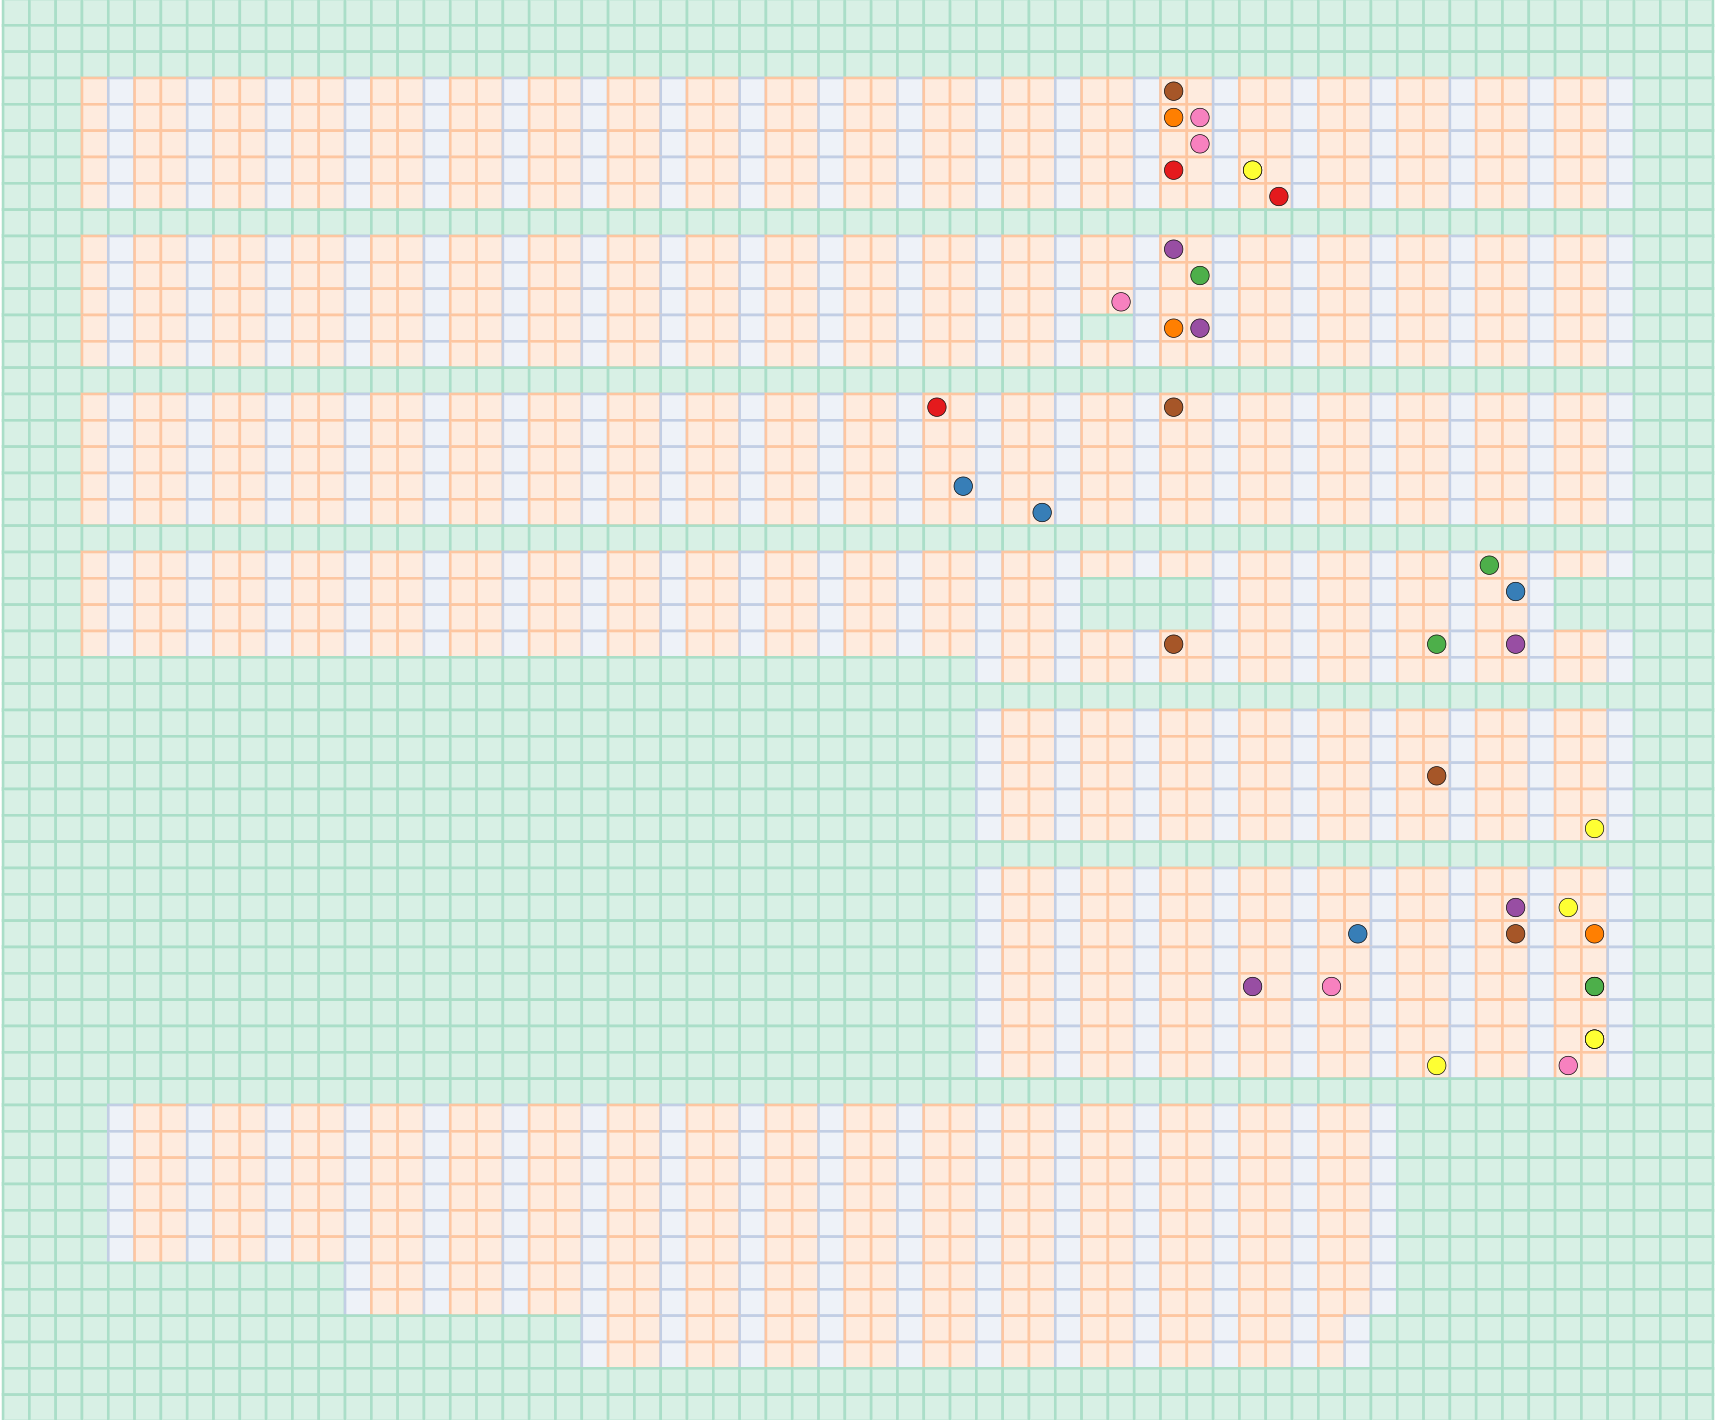
This might not seem like a very useful display, but it can be under certain circumstances. One logical way to organize merchandise in a warehouse is by size. This is due to the fact that each customer receiving a Fix is likely receiving items that are the same size. While this assumption about clients holds quite often, there are exceptions.
For example, look at this long pick path that crosses three merchandise zones (S, M, and L–XL):
It’s not obvious from the pick path display why this path is so long, but if we switch to the color-coded by shipment id display, it becomes obvious fairly quickly that there is no way that a batch could have been constructed for these shipments that didn’t cross three zones and nearly the entire potential warehouse space.
Two shipments—the orange and pink-coded (and encircled for emphasis)—contain items that are mostly spread sparsely throughout the L–XL zone, but with one item that is a S:
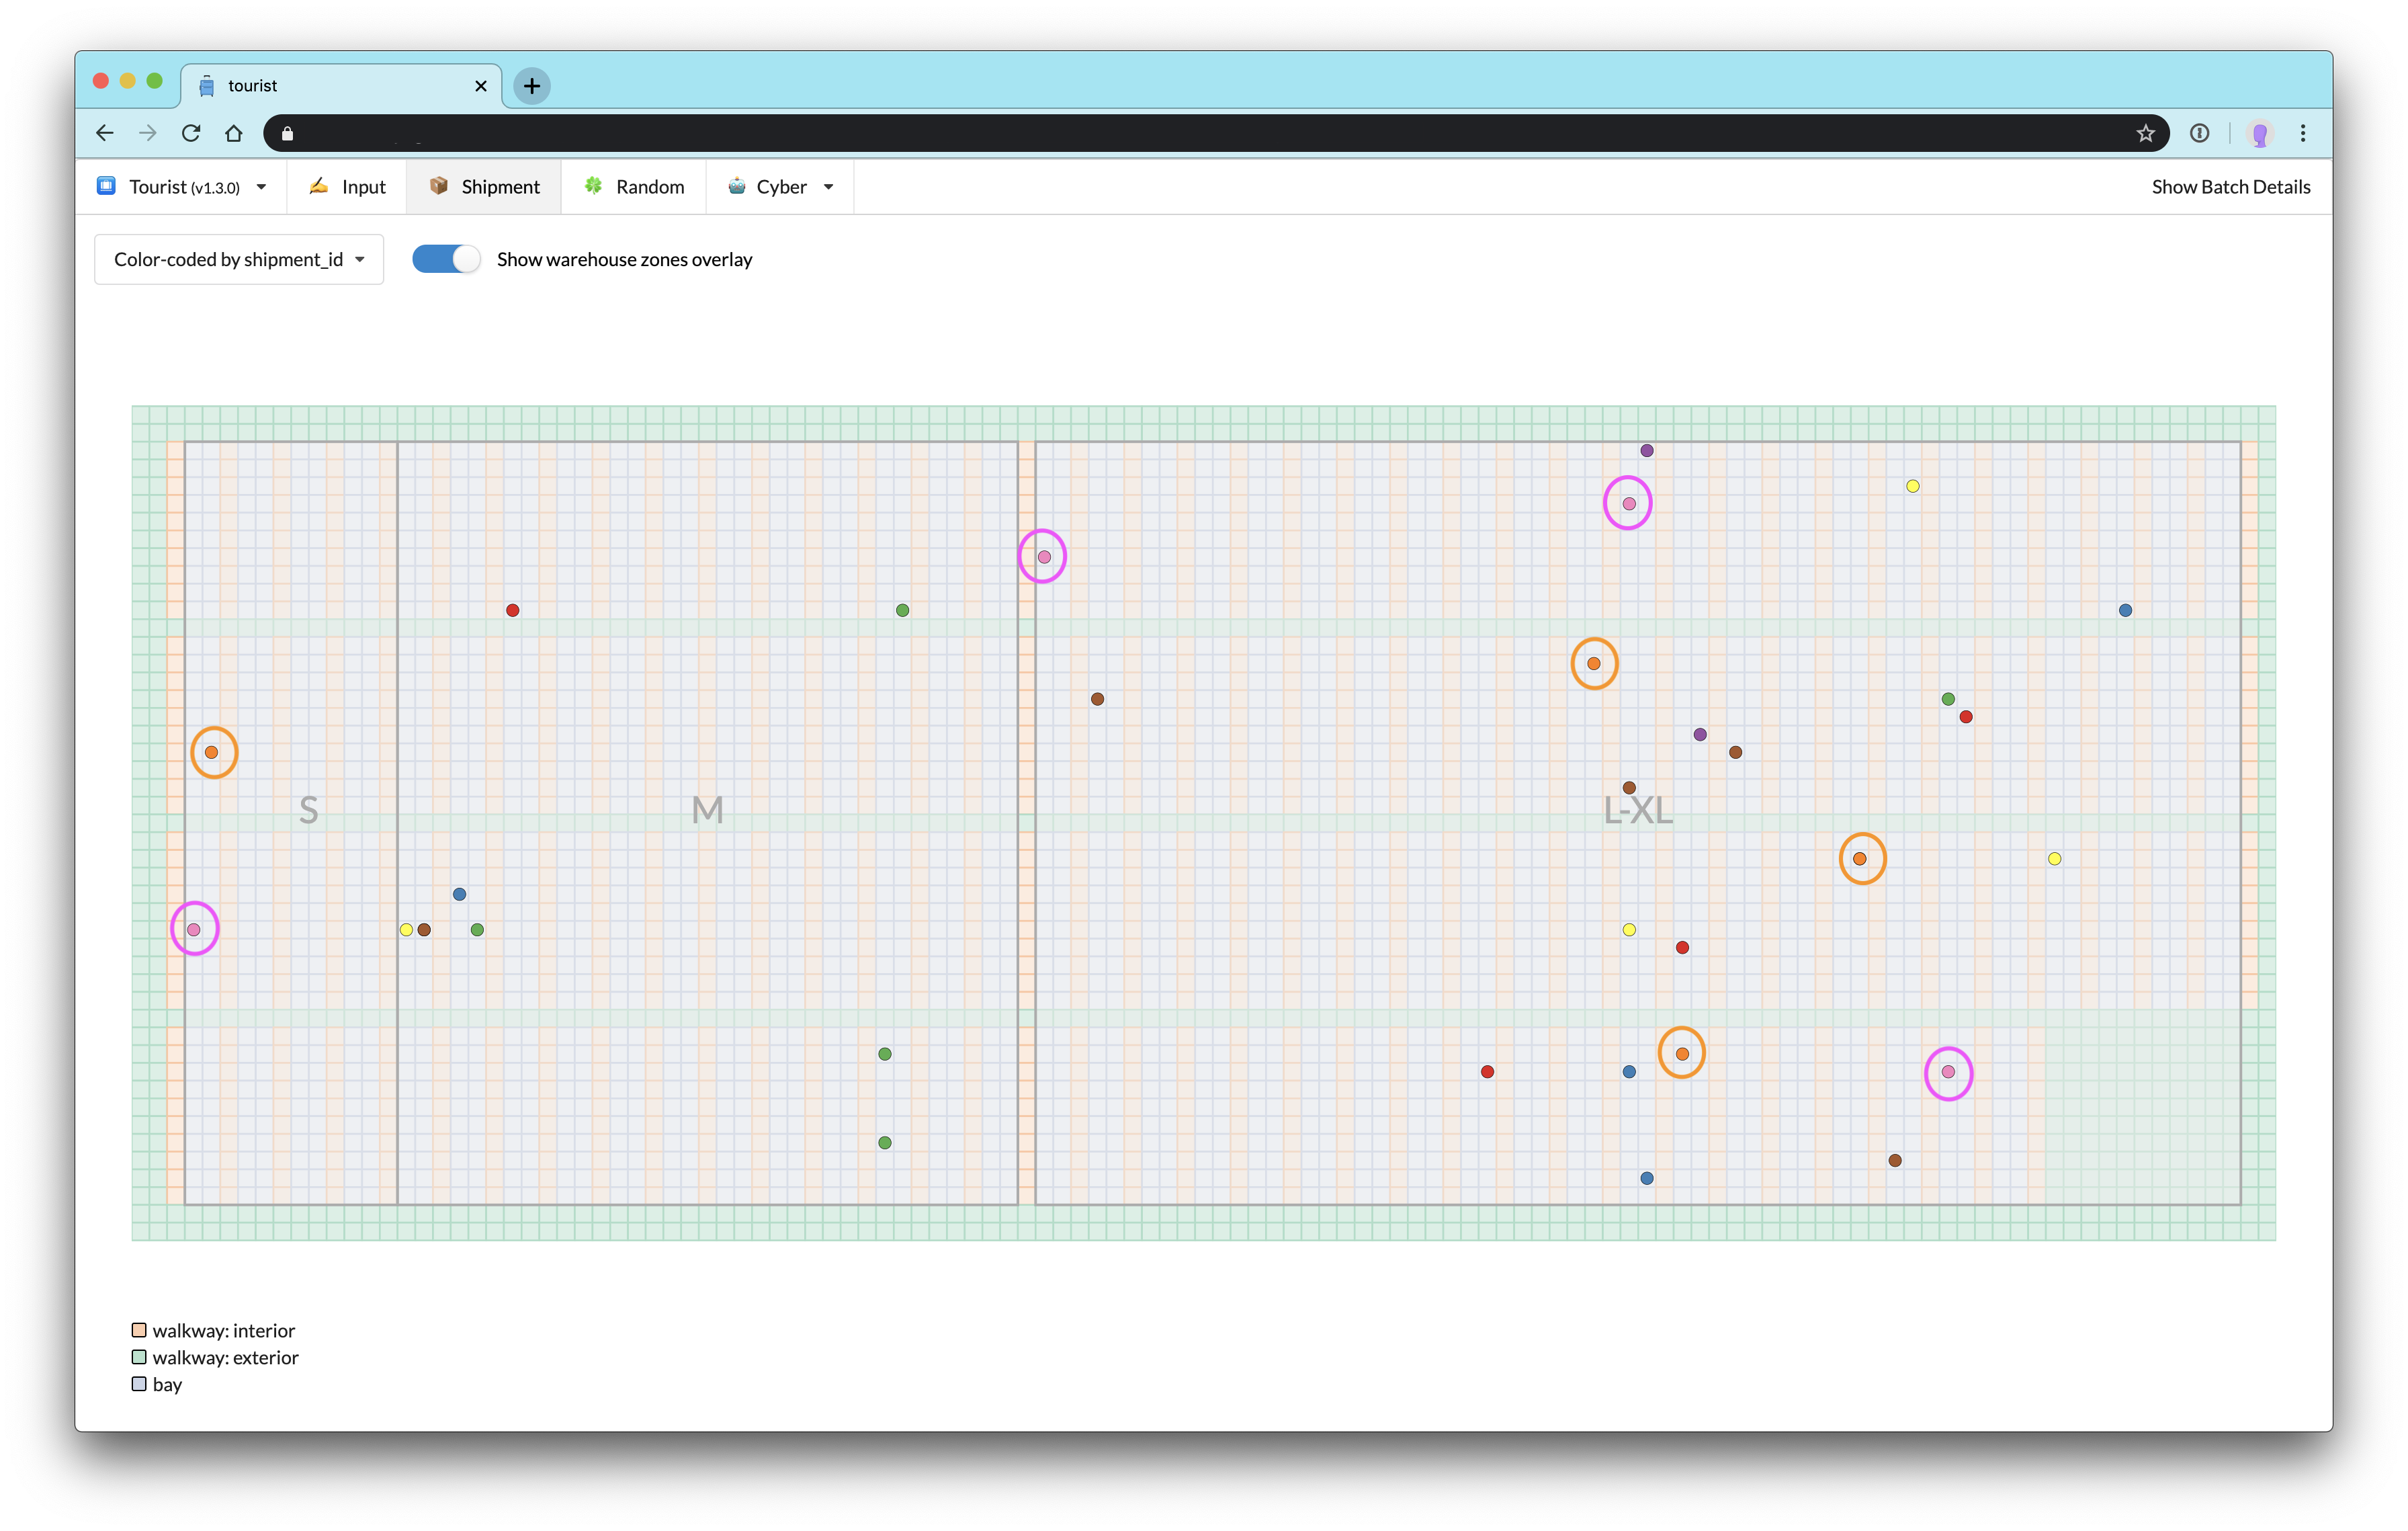
Strange? Yes. Possible? Absolutely. Some clothing brands run large or small, and some clients prefer different styles of fit in their tops versus their bottoms—perhaps preferring roomy bottoms with fitted tops or oversized tops with plenty of leeway to drape creatively or tuck into a fitted waistband. Human bodies come in a wide variety of shapes and sizes, after all. The best we can do with shipments like these is to group them together in batches that will cover a lot of area so that they don’t cause other batches to cover any more area than necessary.
Now that we have Tourist, our Operations team can look up batches and quickly see whether further investigation into a particularly long or “weird” pick path is necessary. This ability to self-serve removes the need for engineers and algorithm developers to investigate bugs that ultimately turn out to be false positives.
And the technical stack?
Tourist is a React single-page application built via create-react-app[5]. It employs React hooks, Redux toolkit, Semantic UI React for UI building blocks outside of the warehouse visualization code, and @reach/router for browser routing. Its “backend” is just our internal API for executing simple SQL queries against single tables in our data warehouse.
The warehouse visualizations themselves are SVG, and in this case d3-scale isn’t even a dependency because the mapping from warehouse schematic to visualization is a dead simple 1 cell: 10px mapping. (Responsiveness to screen size is achieved by using percentages for the <svg> element’s width and height but then defining a viewBox based on the 10px-per-cell scaling.)
The pick path animation is accomplished with nothing more complex than CSS transitions defined via styled-components (which is part of our customized set of create-react-app dependencies). An early version employed react-spring for the path animation, but it wasn’t performant without refactoring the component tree to avoid unnecessary re-renders, and CSS transitions turned out to be perfectly adequate for the job.
[1]↩ “Good,” not “optimal” because we need to sequence several batches per second, and sequencing is a well-known NP-Hard problem.
[2]↩ For the curious, our warehouse layouts are actually laid out schematically in the cells of a Google Sheet (with very strict editing controls!). A nightly ETL reads every tab of this sheet and stores the current warehouse layout (each cell designated as item bay, walkway, etc., with higher-order designations for “zones” as well) in a table in our data warehouse where it can serve as the input to the batching and pathing algorithms.
[3]↩ Recall that at Stitch Fix Algorithms is a separate department from Engineering.
[4]↩ Why shipment id and not batch id? It’s complicated.
[5]↩ Our Algorithms UI team creates so many create-react-app (CRA) apps that we actually built a CLI wrapper around CRA that modifies the output for our environment by editing the boilerplate, installing additional dependencies, and setting up things like commit hooks to enforce linting and code styling. We are currently working on replacing this wrapper (codenamed 👩🎤 rappstar for React app starter) with a custom CRA template.