Data scientists write tasks that transform data, train models, do queries over large datasets, and deploy these models into production. We have championed autonomy for our data scientists and given them the ability to go end-to-end without needing direct support from engineering.
Since our last post on Flotilla, we’ve continued to modify it to support Kubernetes and Spark. This post summarizes the changes we made to Flotilla to help support Spark and some generalizable lessons that others in the Kubernetes/EKS community can benefit from.
Our usage of Spark
We run about 8,000 Spark jobs/day; most read and write from the data warehouse. Some of them are doing model training or scoring. About 100 Data Scientists own the individual Spark jobs. The jobs get triggered via scheduled workflows, external triggers, or human action. We also use Spark for data exploration via notebooks and internal abstractions that simplify use and provide a programmatic interface.
Our challenges with EMR on EC2
EMR on EC2 has served our production Spark workloads for over five years, it has served us well. However, there are some limitations we experienced.
Non-adaptive Provisioning
We face some operational and business challenges while running Spark on EMR. Our scheduled workloads tend to have some seasonality. However, the ad-hoc exploration of the researchers tends to be unpredictable, with bursts of high usage. While it is always a challenge to predict compute resources needed at a given time, we were either over-provisioning or under-provisioning. In turn, this led to suboptimal outcomes (e.g., wasted resources or queued jobs).
Lack of Spark version agility
A given EMR cluster couldn’t run multiple versions of Spark simultaneously. The consequence of this was a burden for migration and testing. We were routinely creating new EMR clusters to test out against new dependencies. The added infrastructure burden delayed upgrades and increased the accumulation of technical debt.
Scattered Visibility
We have internal abstractions for issuing the Spark jobs. However, some of the underlying infrastructure bubbled through (e.g., the YARN resource manager, links to s3 log files, etc.). This created a leaky abstraction where there wasn’t a single place to visualize Spark job metrics, Executor/Driver Logs, and the Application UI.
The user experience was suboptimal for debugging (e.g., examining why a job failed). Also, data scientists had to hop between services to get to the root cause. For instance - debugging executor failures due to out-of-memory was often tricky. Data scientists often needed to look through a separate dashboard to cross-reference their memory consumption. Since Spark is a distributed computational framework - failure stack traces wouldn’t always be informative about the root cause since it maybe a red herring.
Lack of configuration agility
Spark jobs can fail for many reasons: code flaws, data issues, insufficient resources (especially executor or driver memory), dependency failures, node failures, or spot terminations. There is a lot of complexity in orchestrating distributed tasks that execute over multiple nodes and even across Availability Zones.
We wanted container metrics, near-immediate access to logs, job exit reason(s), and the ability to change the underlying execution environment to remediate the failure reason(s) automatically.
Our Approach: Migration to EKS
The driving goal was to provide our data scientists’ the best user experience and reliability of job execution to our data scientists’. What if we made it easier for users to know what went wrong so they could adjust and if we could automatically adapt to their resource usage patterns?
We already use AWS EKS to run our batch computation. From that perspective, we were faced with the decision to either use Spark’s integration with Kubernetes or use EMR on EKS. Our choice was EMR on EKS since it offered a simpler integration path and good binding for IAM, EMRFS, and S3, and AWS-provided integrations and container images.
Autoscaling and Custom Scheduler
We use Cluster Autoscaler on our EKS clusters and, as Spark pods are scheduled, EKS cluster nodes are added or removed based on load. We use an aggressive Cluster Autoscaler configuration to cull nodes after an unused interval of 5 minutes and a scanning interval of 1 minute.
We also use a custom scheduler on our EKS clusters to efficiently pack our nodes. Below is the scheduling policy used. The custom scheduler policy ensures nodes are well utilized, and the cluster autoscaler culls those unused nodes. The priority “MostRequestedPriority” favors nodes with the most requested resources.
This policy will fit the scheduled Pods onto the smallest number of Nodes needed to run your overall set of workloads. The default scheduler favors LeastRequestedPriority. This result favors the even distribution of load across the cluster.
{
  "kind":"Policy",
  "apiVersion":"v1",
  "priorities":[
    {
      "name":"MostRequestedPriority",
      "weight":25
    },
    {
      "name":"BalancedResourceAllocation",
      "weight":20
    },
    {
      "name":"ImageLocalityPriority",
      "weight":5
    },
    {
      "name":"ServiceSpreadingPriority",
      "weight":1
    },
    {
      "name":"NodePreferAvoidPodsPriority",
      "weight":1
    },
    {
      "name":"NodeAffinityPriority",
      "weight":1
    },
    {
      "name":"TaintTolerationPriority",
      "weight":1
    },
    {
      "name":"SelectorSpreadPriority",
      "weight":1
    },
    {
      "name":"InterPodAffinityPriority",
      "weight":1
    },
    {
      "name":"EqualPriority",
      "weight":1
    }
  ]
}
Container Images
Our container images derive from the official EMR on EKS images. We compose our binaries and dependencies with these official images. In the end, we have separate images for different versions of Spark and Python.
Meanwhile, the same cluster can run multiple versions of Spark. This significantly simplifies the testing and validation process. Testing a new version only requires producing a new container image base and running an ad hoc testing job.
Also, we install commonly used dependencies (gcc, boto3, numpy, pandas etc.) into our container images, which reduces the startup time. Further, each cluster node uses the image pre-puller pattern to cache the Spark images to improve job startup time.
Job and Pod Events
We combined EKS pod events and EMR on EKS CloudWatch events to get a complete picture of a Spark job. The pod events are very granular and provide visibility into the setup, execution, and tear down of a job. The EMR events give a high-level overview of the job state (i.e., queued, started, or finished).
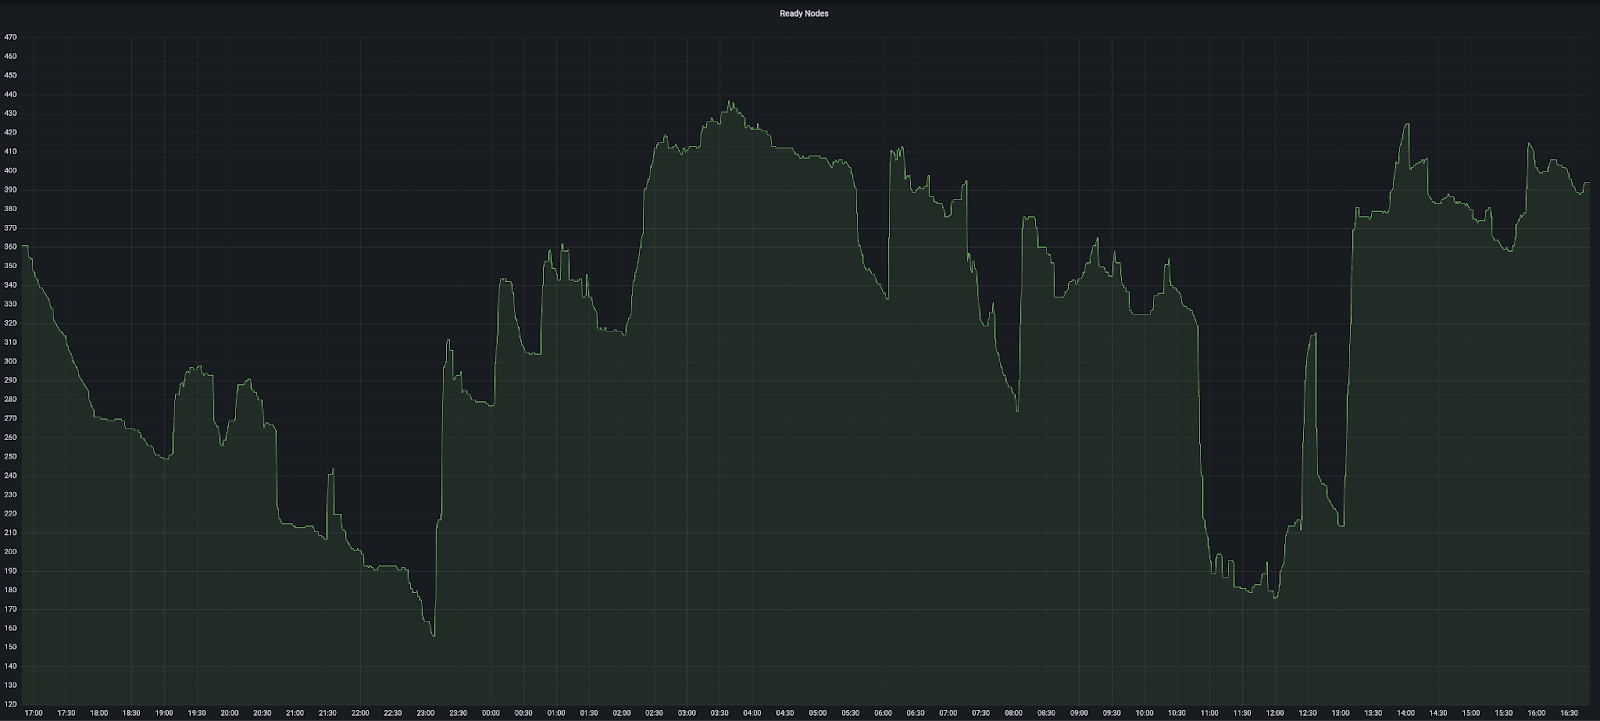
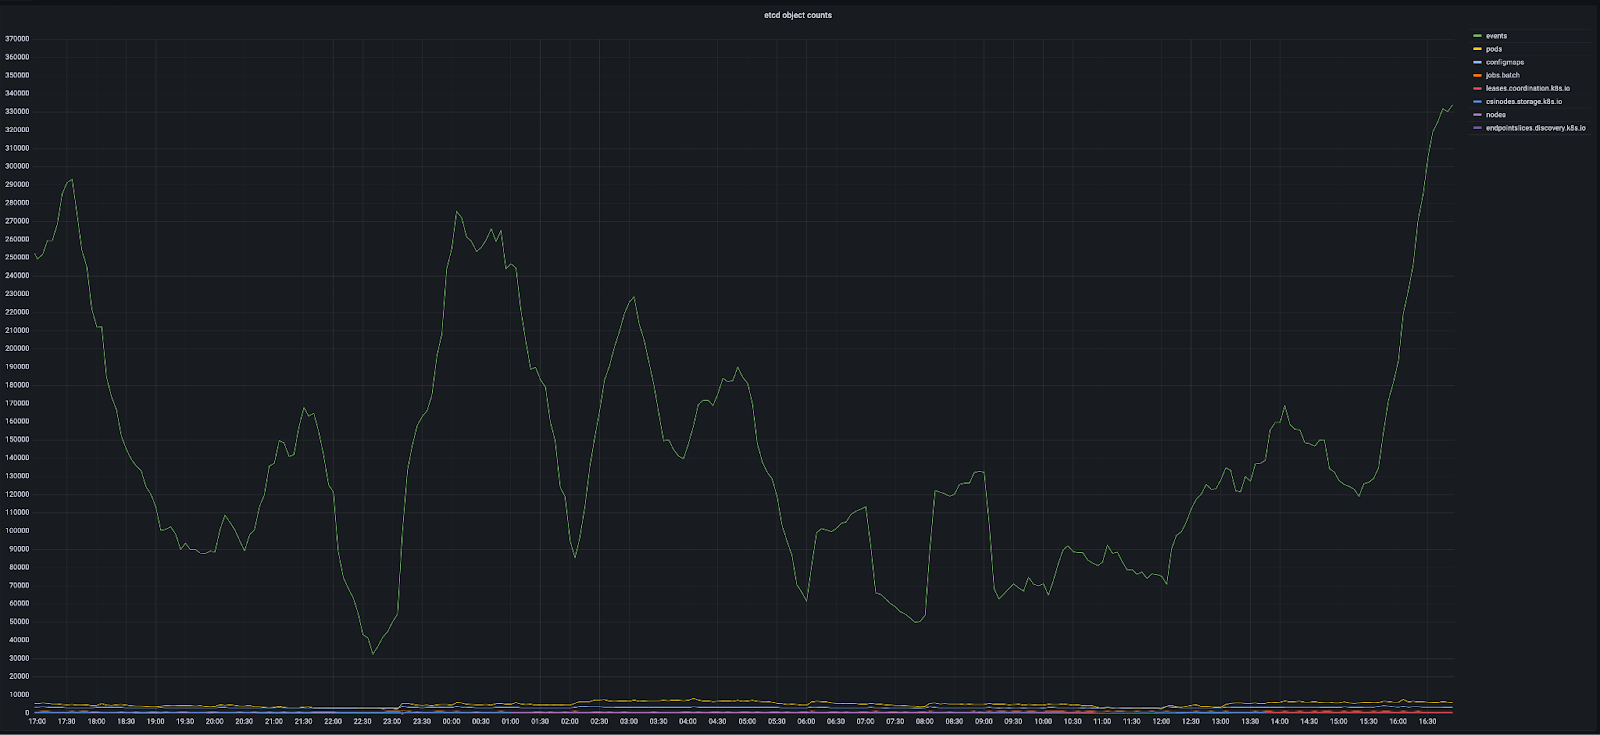
Currently, EKS doesn’t provide a way to set a TTL on Kubernetes events. Under heavy load, the large number of event objects have the potential of overwhelming the etcd cluster. Monitoring object counts and etcd request latency has been essential in preventing etcd failures.
Logging
The Flotilla user interface streams the logs from S3 log locations created by the Spark job execution. Each of the container logs comes from the driver, executor, and controller pods.
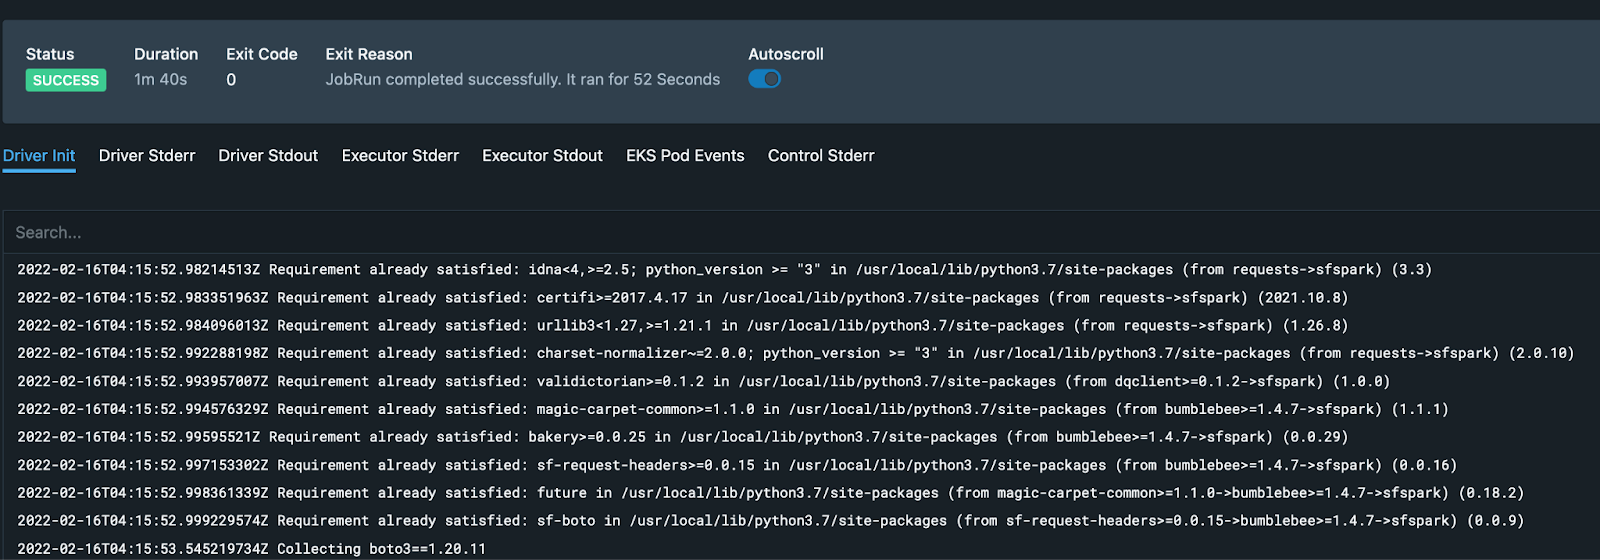
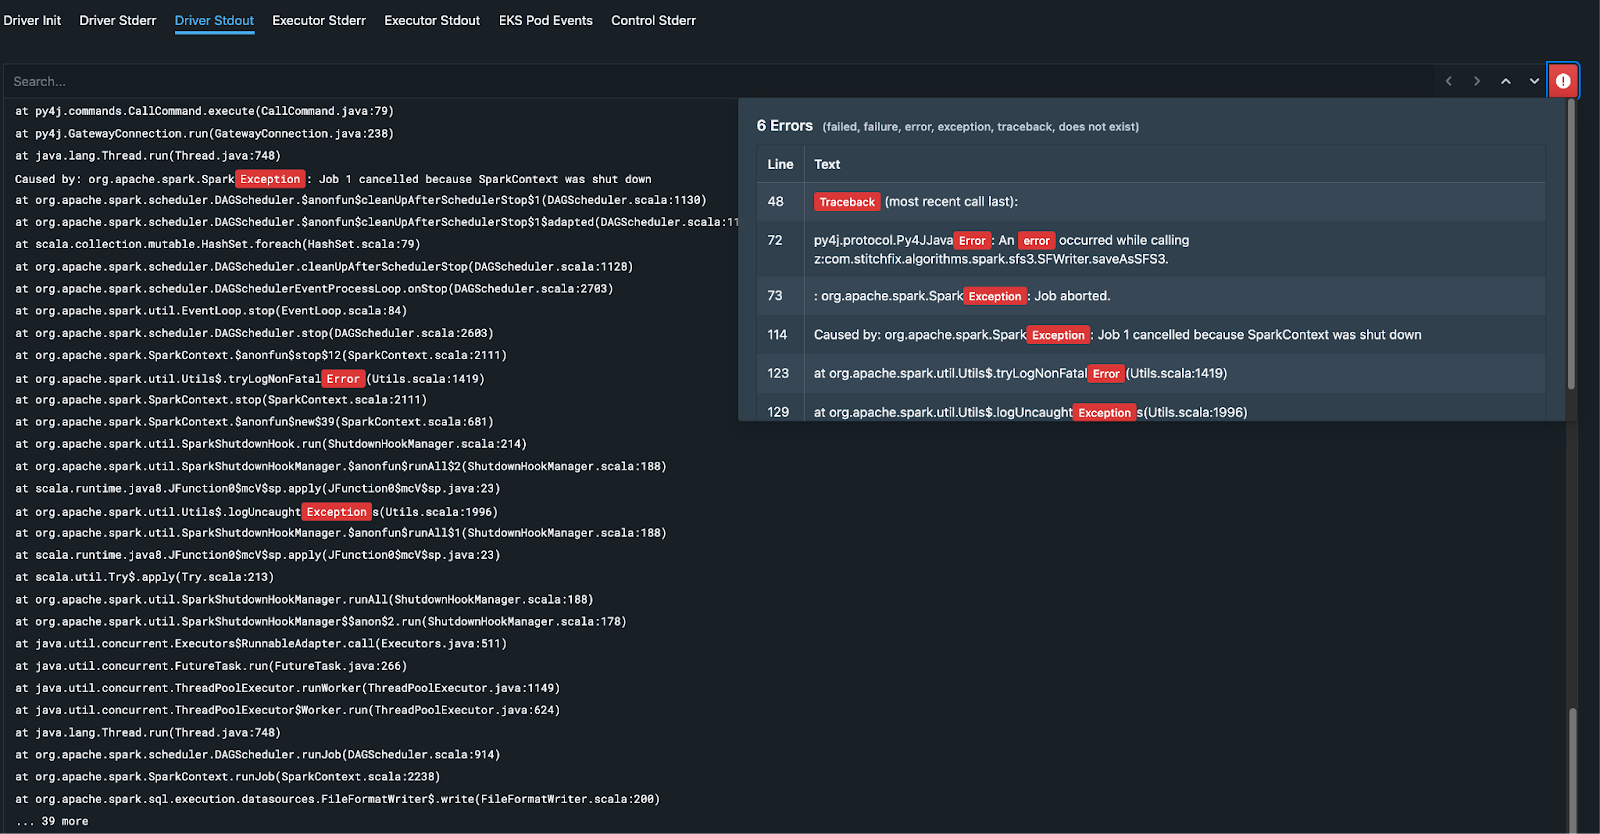
A data scientist sometimes needs to dig into the Spark job logs to get a better understanding of the failures or performance issues. We surface all the jobs logs in a unified user experience to make tracing and debugging easier for the data scientist. Also, we extract and highlight errors and exceptions for quicker resolution.
Metrics
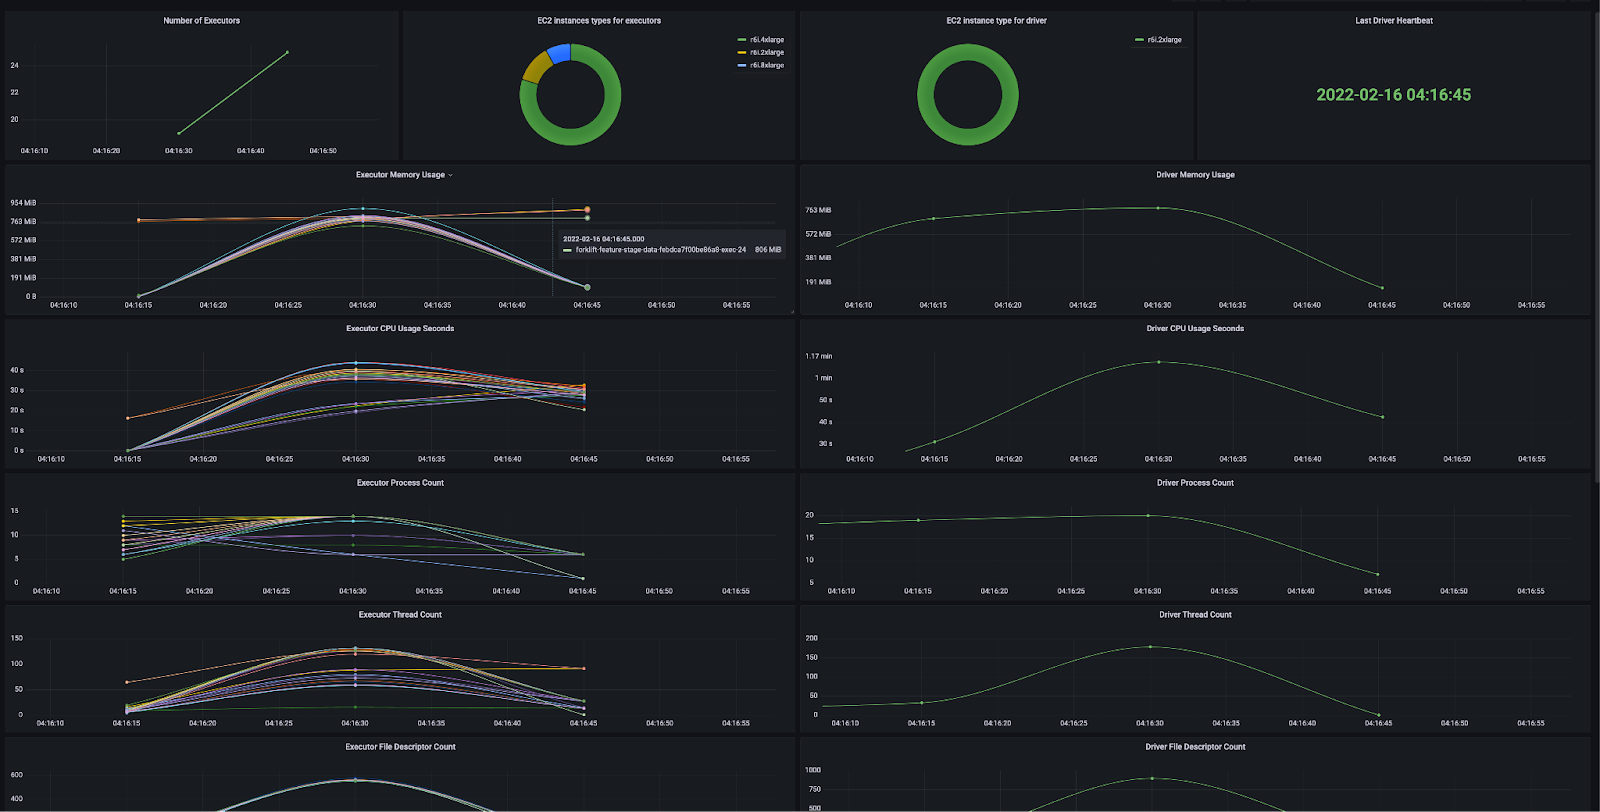
As the containers are running on EKS, we have the cluster instrumented with Victoria Metrics to collect detailed container metrics. These metrics are visualized via Grafana. With these tools, we can diagnose difficult shuffles, disk spills, needed or unneeded caching, mis-sized executors, poor concurrency, CPU throttling, memory usage, network throttling, and many other job execution details.
Spark Application UI
Active Jobs
By default, the Spark driver pods establish an internal Cluster IP-based service for the Spark drivers and expose the Application UI on port 4040. Our users of Spark are outside of this cluster. To mitigate this, we implemented a proxy that exposes the Application UI without setting up an ingress or externally facing service. Due to the high volume of jobs, setting up LoadBalancers or Ingress would have been expensive (and potentially run into API limits). Instead, the proxy runs on a persistent DNS and uses job id to the path to locate the appropriate Spark Driver service within the cluster.
Completed Jobs
We use the JSON event log file saved on S3 and a persistent history server to serve the UI for completed applications on job completion.
Adaptive Behaviors
The other side of the coin to observability is remediation and resolution. We have tried to solve some of the common failure reasons for Spark jobs through automatic adaptation of the configuration.
Executor and Driver Memory
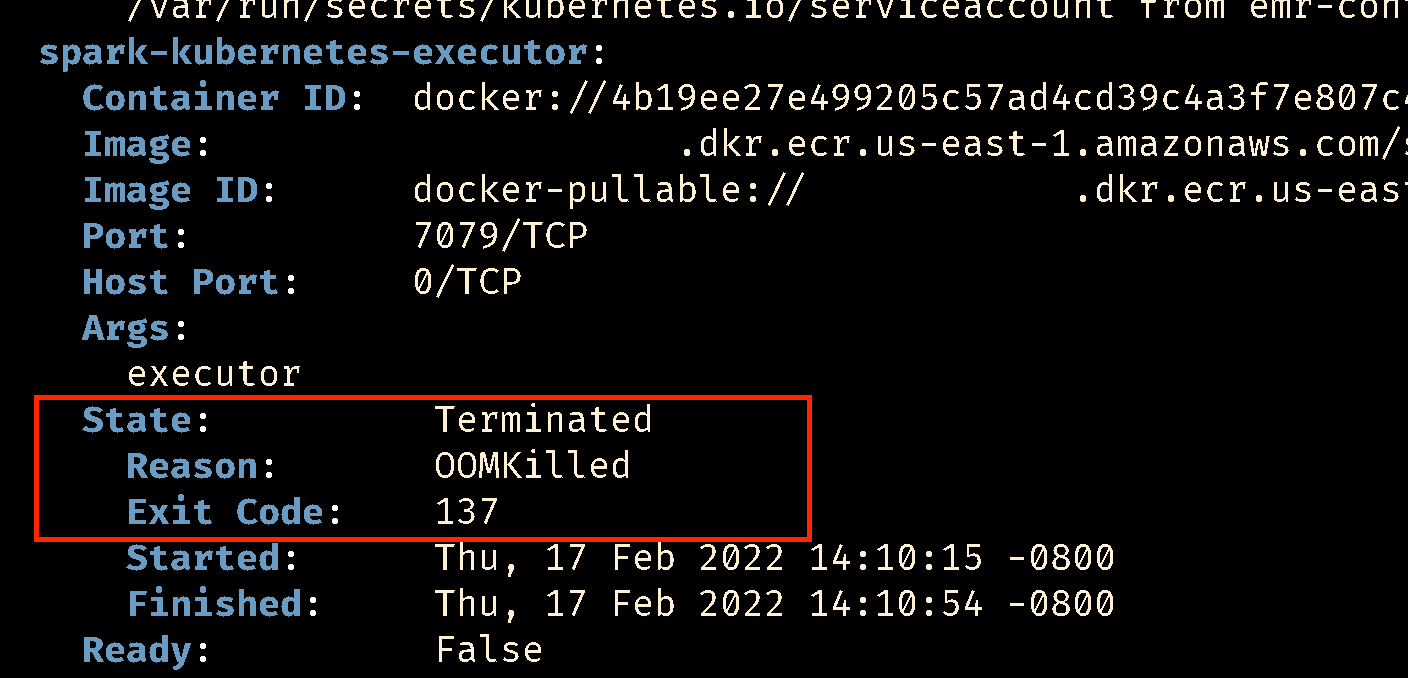
If a job failed due to Executor or Driver running out of memory (exit code 137). We automatically schedule the next run with more memory.
Executor Counts
When a job is retried, we progressively increase executor counts (until a max limit is reached). This helps us smoothen out failures that may have been caused by data seasonality or failures due to data partitioning. The progression also helps start at a lower number of default executor counts. This helps with trying to strike a balance between the total number of executor pods versus the size of the EKS cluster.
Exception Extraction
The exception and stack traces that are extracted from the logs helps us identify retryable errors, like downstream 5xy errors or transient errors.
Node Affinity Selection
Spot nodes offer a significant cost advantage over on-demand instances. However, they can suffer from sudden terminations. We always run the driver pods on on-demand instances, and the executors can be scheduled on spot or on-demand instances. If a job is business-critical or we deem that the current climate is prone to a high likelihood of spot termination, we also schedule the executors on on-demand instances.
Flotilla assigns job retries on on-demand instances. The node selector optimizations help us keep a high SLA and minimize the infrastructure costs. We can make a runtime decision on where and how a job runs without needing to provision new clusters.
Outcomes from the migration to EKS
More predictable job execution
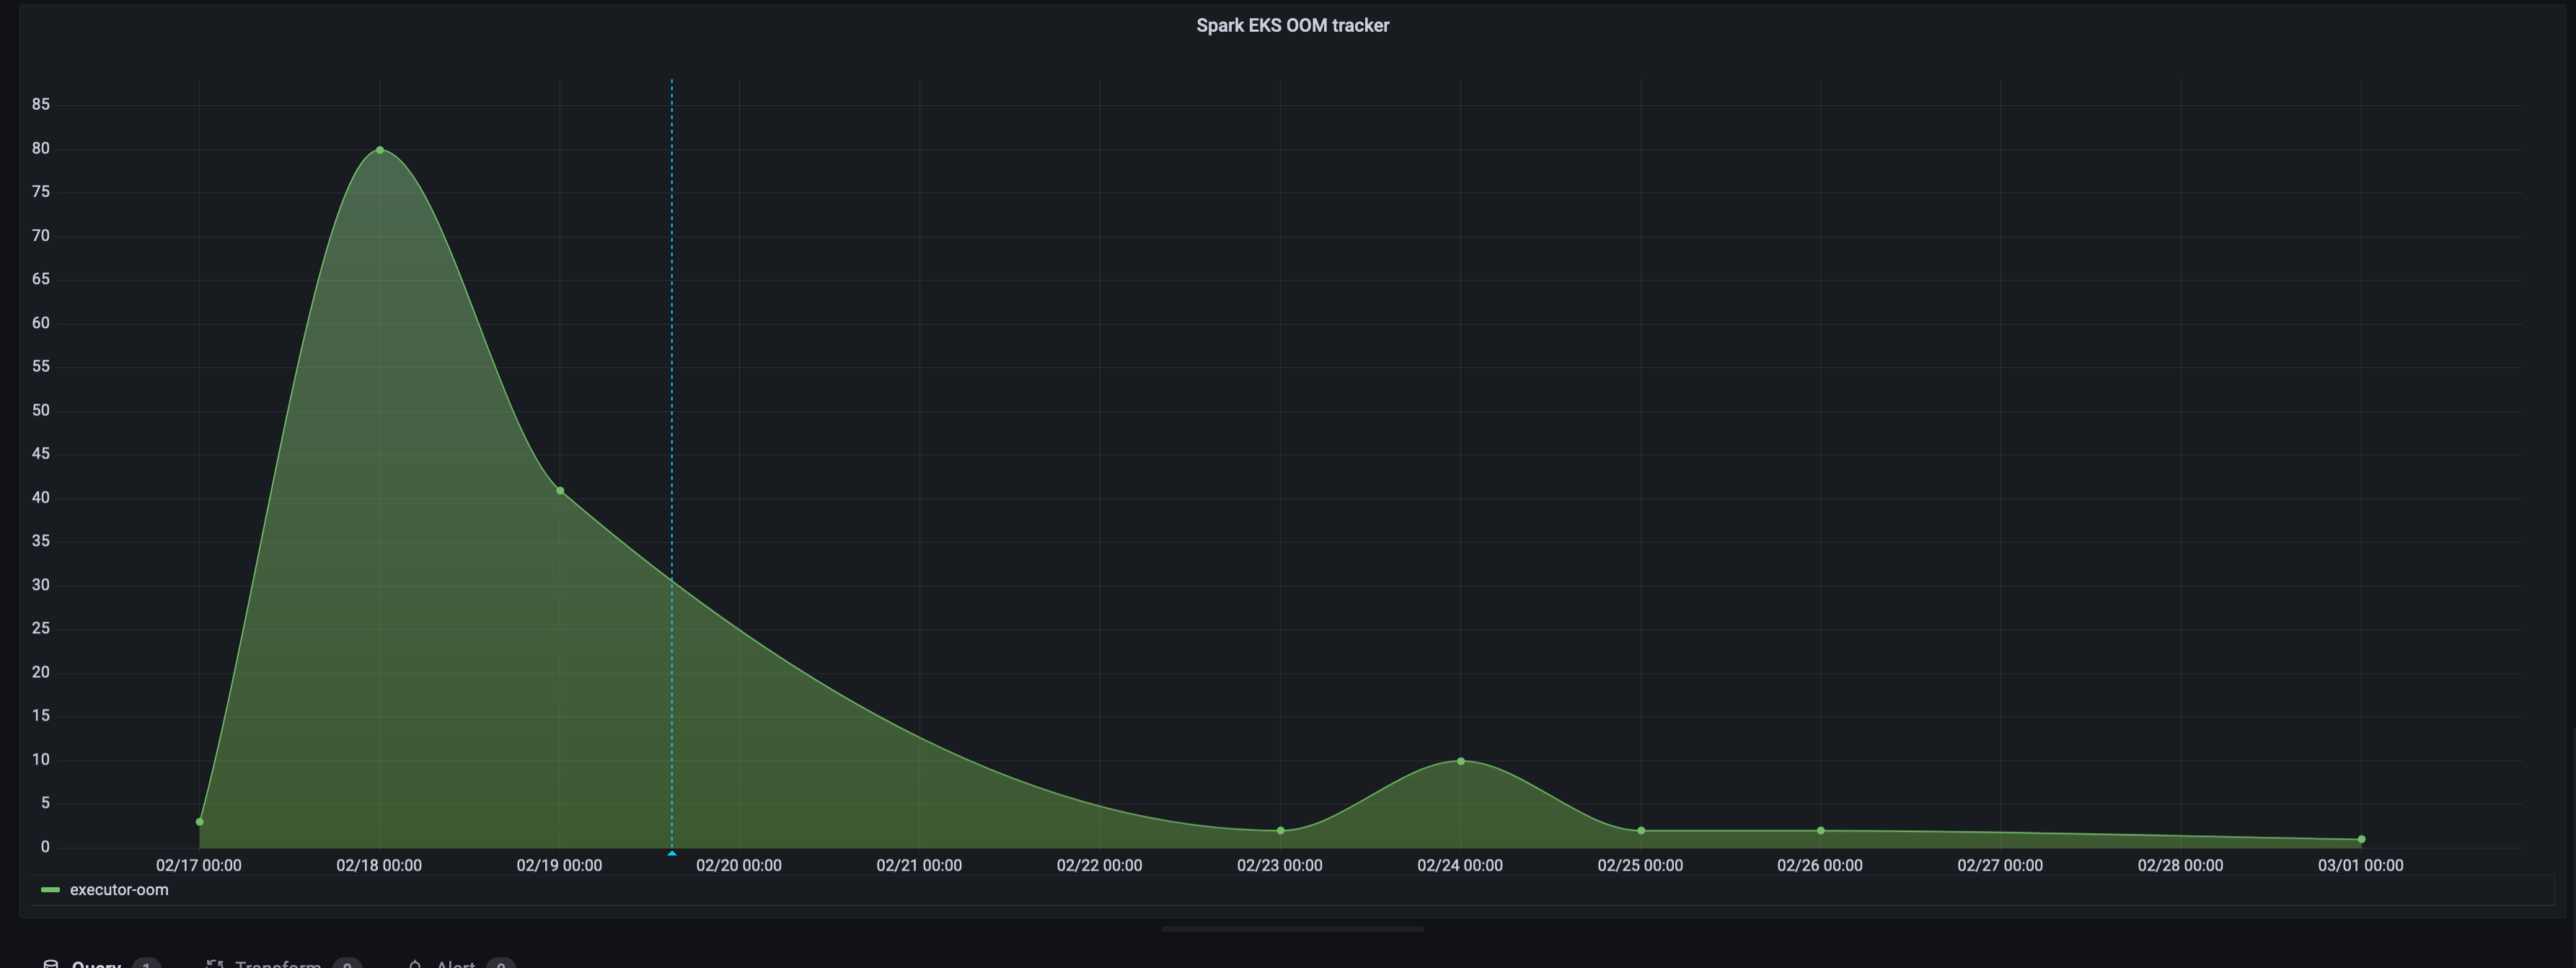
We are seeing about a 25% reduction in job failures due to timeouts and a 90% reduction in job failures due to out-of-memory errors. Scheduling delay with a p99 of around 5 minutes (when resources need provisioning). Job execution improvements translate to fewer alerts and pages for our data teams to diagnose in more direct terms.
Reduction in infrastructure cost
We are seeing about a 45-55% reduction in infrastructure cost for all our Spark-based compute. We can spin up resources faster and react to incoming demand. Also, aggressive node packing and culling strategies help reduce waste.
Reduction in operational burden
The EKS cluster scales up and down as per the demands of the pods, and we have guardrails in place to prevent runoffs. We monitor and alert on cluster and service metrics. However, we utilize the elasticity of the cloud to meet our internal SLAs.
Improved ability to fix failing Spark jobs
We have better visibility into job state via a unified view into logging, metrics, and events. The enhanced visibility has helped our Data Scientists resolve problems more quickly and easily and thus become more productive.
Convergence on Kubernetes
The migration to running Spark on EKS has helped reduce our technology skew and converge on a standard set of tooling. The use of containerized workloads also offers the benefits of utilization of clusters for disparate workloads while providing a common pattern of deployment and auditing.
Flotilla initially started as an abstraction layer on AWS ECS. Over time we have adapted it to use Kubernetes as the backend. Refactoring Flotilla as a Kubernetes Operator presents some advantages. It simplifies the job reconciliation loop and opens up possibilities for more native integration with Kubernetes.